You must be logged in to post your query.
Home › Forums › Chart Support › Creating data Tables in charts
Tagged: Creating data Tables in charts as in excel
Hi , Is there a wat to insert data tables as chart elements as in excel inside bar charts?
@sherin,
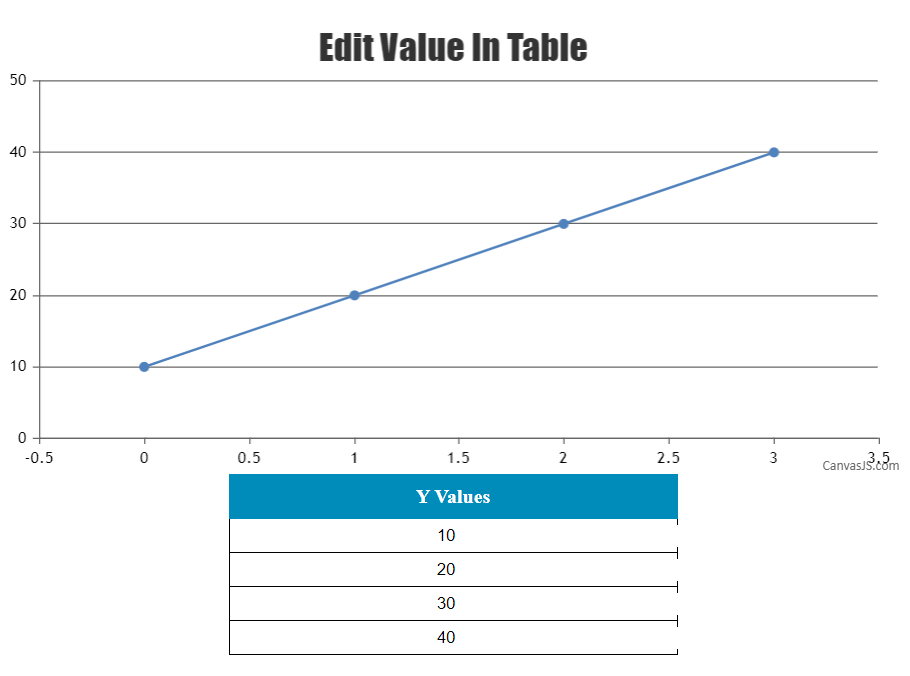
You can easily create a chart using the values from HTML Table data and can also update the dataPoints once the table data is changed as shown in the code snippet below:
document.getElementById('customTable').addEventListener("change", function (e) { index = e.target.parentNode.parentNode.rowIndex; if (!chart.options.data[0].dataPoints[index - 1]) chart.options.data[0].dataPoints[index - 1] = {}; chart.options.data[0].dataPoints[index - 1].y = Number(e.target.value); chart.render(); });
Please take a look at this JSFiddle for a working example with sample code on rendering chart from HTML Table data.
___ Suyash Singh Team CanvasJS
Hi, Can I create one with legend keys .
Sorry, I am unable to understand your exact requirement. Can you please help us with some more explanation on what do you mean by “legend keys” so that we can understand your scenario better and help you out?
Can you let us know if you are looking for Legends ?
Hi, I was taking about datables in excel. Please see this link . http://www.dummies.com/software/microsoft-office/excel/chart-data-tables-and-excel-pivot-charts/
I want to create exactly as in excel these data tables.
Sorry, this feature is not available as of now.
___ Suyash Team CanvasJS
You must be logged in to reply to this topic. Login/Register