Last one year has been very good for us in terms of number of users/companies adopting our charts including several Fortune 100 Companies. We were also featured on ProductHunt. Many of our customers are impressed with the performance and ease of using CanvasJS Charts – this is what we have been striving for since the release of first version and we’ll continue to work towards making the Charts as user friendly as possible.

Here are some of the Major Features we’ve released and related articles.
- Multiple X & Y Axis – more info
- Logarithmic Scale for both X & Y Axis – more info
- Axis Reversal Feature for both X & Y Axis – more info
- Ability to show discontinuity of dataPoints – more info
- Auto-labelling to automatically handle label placement in the best possible way – more info
- API to Sync Axis of Multiple Charts – more info
- Vertical Zooming – more info
- Static Methods for formatting Numbers and Dates – more info
- Now you can have any number of Subtitles in a chart – more info
- Ability to Show Title and Legend inside the PlotArea which frees up space for the data being plotted – more info
- Custom Formatter for Axis Labels, Index Labels, Legend Items and Stripline Labels – more info
- Line Styles like dashed, dotted, etc using lineDashType – more info
- Keyword Support in Legend Text – more info
- jQuery Plugin – more info
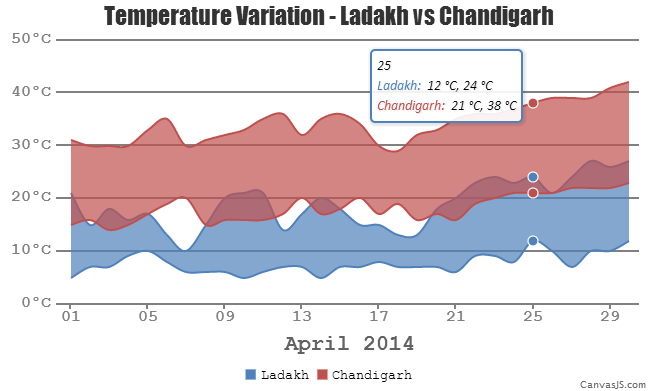
- Stock Charts, Range Charts – more info
- Animation In Charts – more info
- Ability to Export Chart as Image – Png/JPEG – more info
Thanks for trusting us and for all the valuable feedbacks that you have given. This has helped us in improving the product and also to increase our team size to 6 – which will further help speed up the development of new features and updates. Do go through all the features mentioned above and let us know if you have any questions or feedback in the forum.
You can download the latest version of CanvasJS from our download page.
Thanks for your time
—
Sunil Urs
Team CanvasJS
Leave a Reply