Login to Ask a Question or Reply
Forum Replies Created by Vishwas R
-
Chart should look same when same options and dataPoints are passed, I don’t understand why it looks different in your case. Could you please create JSFiddle reproducing the issue so that I can look into it and resolve it.
—
Vishwas R
Team CanvasJSSateesh
Please take a look at our jQuery Gallery for an example on Chart inside resizable container. You can also make it draggable as shown in this JSFiddle.
Please share code to my mail id which is mentioned below.
We don’t provide email-based support however please refer the links shared above, which includes source code.
—
Vishwas R
Team CanvasJSOctober 25, 2018 at 9:56 am in reply to: how can i get the max, min, avg and current value of any multi series chart #23197You can update chart options dynamically. Please take a look at documentation on Updating Chart Options and Data for the same.
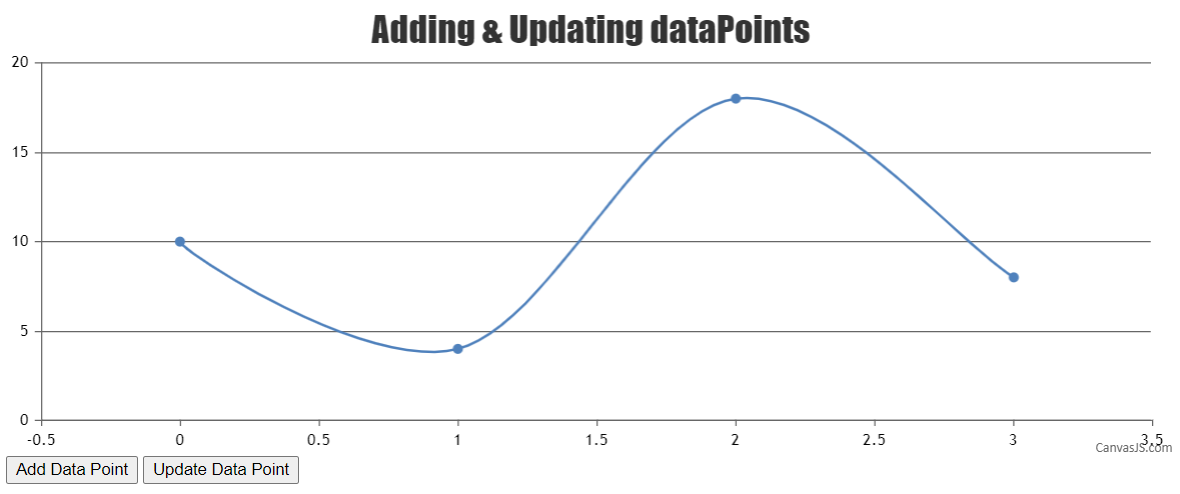
In your case, you can just update dataPoints of same dataSeries rather than removing dataSeries and adding new one. Please take a look at this JSFiddle.
—
Vishwas R
Team CanvasJSIf the length of video (in seconds / milliseconds) matches with the range of axisX (in seconds / milliseconds), you can seek video based on clicked position – with the help of convertPixelToValue method. Please take a look at this JSFiddle.
—
Vishwas R
Team CanvasJSYou can read data from database and parse it according to your requirements. Please take a look at this sample project where stacked-column chart is rendered by accepting
regDate and functionfields from database. You can further customize it to read any field based on your requirements and render chart.Also refer this forum thread for more info on rendering chart in PHP with data from database.
—
Vishwas R
Team CanvasJSOctober 23, 2018 at 10:17 am in reply to: how can i get the max, min, avg and current value of any multi series chart #23171It would be helpful for us to understand your issue better if we could run the code locally at our end and try out the scenario you are talking about, but the code that you have shared is partial, which we can’t make it work at our end. So I request you to create sample project reproducing the issue you are facing along with sample data and share it with us over Google-Drive or Onedrive.
—
Vishwas R
Team CanvasJSDaniel,
Glad that you figured out a way to make it work :)
—
Vishwas R
Team CanvasJSCan you kindly share the sample project reproducing the issue you are facing along with sample database over Google-Drive or Onedrive so that we can look into the structure of database and your code, understand your scenario better and help you out?
—
Vishwas R
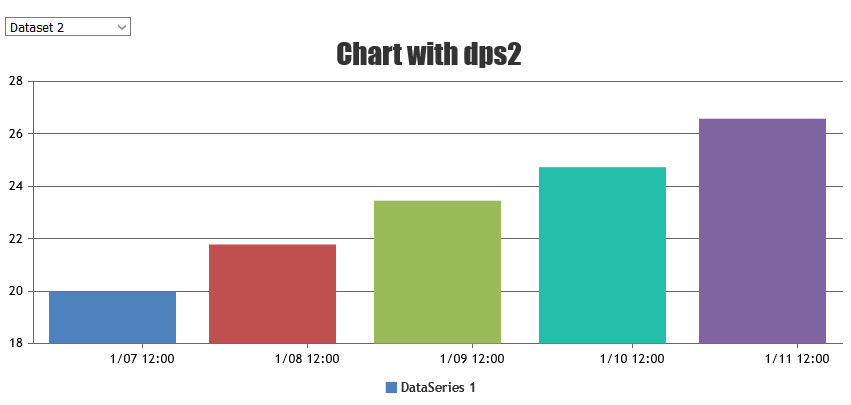
Team CanvasJSOctober 22, 2018 at 4:02 pm in reply to: how can i get the max, min, avg and current value of any multi series chart #23151You can render chart with dataPoints based on the values being selected from dropdown using change event. Below is the code-snippet for the same.
$(".dropdown").change(function() {
	chart.options.data[0].dataPoints = [];
  var e = document.getElementById("dd");
	var selected = e.options[e.selectedIndex].value;
  dps = jsonData[selected];
  chart.options.title = { text: "Chart with " + selected };
  for(var i in dps) {
  	var xVal = dps[i].x;
    chart.options.data[0].dataPoints.push({x: new Date(xVal), y: dps[i].y});
  }
  chart.render();
});
Please take a look at this JSFiddle for complete code.
But i am facing an issue, i want to add data series using a multiselect dropdown,
It would be helpful for us to understand your issue better when we look at your code working live in jsfiddle. So I request you to create jsfiddle reproducing the issue and share it with us.
—
Vishwas R
Team CanvasJSThe issue seems to happen due to overriding of window.onload event. Changing it to jQuery ready / load should work fine in your case. Please find the sample project here. Please refer this stackoverflow thread for more info.
PS: dataPoints are hardcoded in sample-project as AJAX requests (php-service-http://globe-trekking.com/vg/charts/top_aircraft_data.php) gave 404 Not Found Error.
—
Vishwas R
Team CanvasJSPlease take a look at this sample project to render multi-series stackedColumn chart with data from database.
—
Vishwas R
Team CanvasJSOctober 22, 2018 at 10:31 am in reply to: can we get series minimum and maximum value of datapoints #23137In update method, you are updating the last dataPoint’s y-value only and not x-value because of which x-value remains same and being shown in crosshair as such. Updating x and y-values should work fine in your case. To keep axis labels constant, please take a look at this sample dashboard. You can download the dashboards sample from our download page and try customizing and running locally.
—
Vishwas R
Team CanvasJSOctober 22, 2018 at 10:08 am in reply to: how can i get the max, min, avg and current value of any multi series chart #23135Yes, it works even if you add few more dataSeries as it’s made generic to work with multi-series.
—
Vishwas R
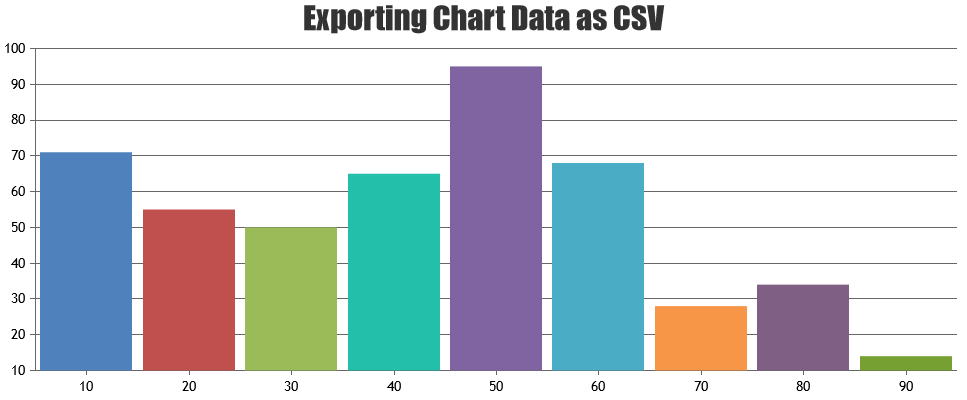
Team CanvasJSExporting chart data as excel / CSV is not available as an inbuilt feature as of now. However with few lines of code, you can convert chart data into comma-separated CSV and download it. Please find the code snippet for the same below.
function convertChartDataToCSV(args) {
  var result, ctr, keys, columnDelimiter, lineDelimiter, data;

  data = args.data || null;
  if (data == null || !data.length) {
    return null;
  }

  columnDelimiter = args.columnDelimiter || ',';
  lineDelimiter = args.lineDelimiter || '\n';

  keys = Object.keys(data[0]);

  result = '';
  result += keys.join(columnDelimiter);
  result += lineDelimiter;

  data.forEach(function(item) {
    ctr = 0;
    keys.forEach(function(key) {
      if (ctr > 0) result += columnDelimiter;
      result += item[key];
      ctr++;
    });
    result += lineDelimiter;
  });
  return result;
}
Please take a look at this JSFiddle for fully functional example on exporting chart data as CSV. Also take a look at this plugin, which does the same.
If this doesn’t help you, kindly share working sample project along with sample database over Google-Drive or Onedrive so that we can try running it locally, understand your scenario better and help you out.
—
Vishwas R
Team CanvasJS