Login to Ask a Question or Reply
You must be logged in to post your query.
Home › Forums › Chart Support › how can i get the max, min, avg and current value of any multi series chart
how can i get the max, min, avg and current value of any multi series chart
- This topic has 15 replies, 3 voices, and was last updated 6 years, 8 months ago by
PaulFansare.
-
October 16, 2018 at 7:17 pm #23084
I want to know that how can i get the max, min, avg and current value of any multi series chart whenever user zoomed in or zoomed out. chart has “x” as timestamp and “y” as value. And here is my code for single chart. hope you would understand.
<div id="chartContainer" style="height: 570px; width: 100%;z-index:1000;background:unset !important"></div>
<span id="MinimumYValue"></span><br/>
<span id="MaximumYValue"></span><br/>
<span id="average"></span><br/>
<span id="currentValue"></span><br/>


<script src="https://cdn.canvasjs.com/canvasjs.min.js"></script>
<script>
window.onload = function () {
var dataSet = [{"x":1521244800000,"y":2080.78565398},{"x":1521331200000,"y":3339.07083767},{"x":1521417600000,"y":4308.28117386},{"x":1521504000000,"y":3658.36528679},{"x":1521590400000,"y":4006.79757639},{"x":1521676800000,"y":3472.95555562},{"x":1521763200000,"y":2840.20012605},{"x":1521849600000,"y":4061.22207624},{"x":1521936000000,"y":2640.61952128},{"x":1522022400000,"y":3440.8925037},{"x":1522108800000,"y":2631.62354568},{"x":1522195200000,"y":2053.23570832},{"x":1522281600000,"y":2457.67748824},{"x":1522368000000,"y":2418.83251667},{"x":1522454400000,"y":3035.32181316},{"x":1522540800000,"y":2372.98886408},{"x":1522627200000,"y":2248.77128516},{"x":1522713600000,"y":4286.68410297},{"x":1522800000000,"y":4378.01680313},{"x":1522886400000,"y":3433.90501537},{"x":1522972800000,"y":1937.84795457},{"x":1523059200000,"y":1776.61778969},{"x":1523145600000,"y":2153.46903307},{"x":1523232000000,"y":3057.63748832},{"x":1523318400000,"y":2273.84496836},{"x":1523404800000,"y":4754.40852848},{"x":1523491200000,"y":16136.63324746},{"x":1523577600000,"y":6408.92589768},{"x":1523664000000,"y":2337.48545888},{"x":1523750400000,"y":3282.03687871},{"x":1523836800000,"y":14576.32407107},{"x":1523923200000,"y":13142.48427231},{"x":1524009600000,"y":4420.2919539},{"x":1524096000000,"y":4960.54815185},{"x":1524182400000,"y":6616.15396694},{"x":1524268800000,"y":4792.02845189},{"x":1524355200000,"y":2629.76601774},{"x":1524441600000,"y":2414.59240519},{"x":1524528000000,"y":6476.53446047},{"x":1524614400000,"y":5226.97485967},{"x":1524700800000,"y":3640.28427753},{"x":1524787200000,"y":4082.49694157},{"x":1524873600000,"y":14424.43089387},{"x":1524960000000,"y":12615.6757021},{"x":1525046400000,"y":6220.50957688},{"x":1525132800000,"y":7339.85452579},{"x":1525219200000,"y":6598.41661802},{"x":1525305600000,"y":6975.94478243},{"x":1525392000000,"y":3755.0646449},{"x":1525478400000,"y":2709.50194651},{"x":1525564800000,"y":2610.21927037},{"x":1525651200000,"y":3253.26600286},{"x":1525737600000,"y":3127.92650838},{"x":1525824000000,"y":3042.58800625},{"x":1525910400000,"y":2498.24840895},{"x":1525996800000,"y":4791.13579915},{"x":1526083200000,"y":3367.61004222},{"x":1526169600000,"y":3034.44892662},{"x":1526256000000,"y":2366.75120596},{"x":1526342400000,"y":2675.02386401},{"x":1526428800000,"y":2647.05979683},{"x":1526515200000,"y":2410.98977609},{"x":1526601600000,"y":2320.02569942},{"x":1526688000000,"y":2197.60960939},{"x":1526774400000,"y":3487.76784468},{"x":1526860800000,"y":2393.15114971},{"x":1526947200000,"y":2270.93427381},{"x":1527033600000,"y":2971.07407358},{"x":1527120000000,"y":2190.22954969},{"x":1527206400000,"y":2802.94964948},{"x":1527292800000,"y":2358.41170816},{"x":1527379200000,"y":2372.32746026},{"x":1527465600000,"y":3579.4446988},{"x":1527552000000,"y":5619.49646763},{"x":1527638400000,"y":6060.79243343},{"x":1527724800000,"y":5653.64139533},{"x":1527811200000,"y":3818.21037893},{"x":1527897600000,"y":3561.5074285},{"x":1527984000000,"y":3658.98486864},{"x":1528070400000,"y":3349.17135202},{"x":1528156800000,"y":3150.58063879},{"x":1528243200000,"y":2998.61911639},{"x":1528329600000,"y":2463.16603987},{"x":1528416000000,"y":2200.52616228},{"x":1528502400000,"y":1966.91710911},{"x":1528588800000,"y":3577.43873126},{"x":1528675200000,"y":2756.28855657},{"x":1528761600000,"y":2703.56912002},{"x":1528848000000,"y":3241.88491858},{"x":1528934400000,"y":4655.81283766},{"x":1529020800000,"y":2342.80051627},{"x":1529107200000,"y":1482.99539683},{"x":1529193600000,"y":1344.9984925},{"x":1529280000000,"y":1675.76512711},{"x":1529366400000,"y":1279.33389318},{"x":1529452800000,"y":1129.09619916},{"x":1529539200000,"y":1140.20708417},{"x":1529625600000,"y":2032.82325202},{"x":1529712000000,"y":840.15233591},{"x":1529798400000,"y":1415.51905104},{"x":1529884800000,"y":1211.86106152},{"x":1529971200000,"y":458.82216966},{"x":1530057600000,"y":692.95510367},{"x":1530144000000,"y":1780.38858481},{"x":1530230400000,"y":2358.39354467},{"x":1530316800000,"y":2745.52938722},{"x":1530403200000,"y":2973.73743572},{"x":1530489600000,"y":3577.05298497},{"x":1530576000000,"y":3267.27565051},{"x":1530662400000,"y":1986.21072621},{"x":1530748800000,"y":2302.54916007},{"x":1530835200000,"y":2489.57562695},{"x":1530921600000,"y":1818.7303121},{"x":1531008000000,"y":1879.9431699},{"x":1531094400000,"y":1775.11912716},{"x":1531180800000,"y":2147.43130723},{"x":1531267200000,"y":2177.78862733},{"x":1531353600000,"y":1661.35223833},{"x":1531440000000,"y":4424.66088934},{"x":1531526400000,"y":2425.19362743},{"x":1531612800000,"y":2007.17764821},{"x":1531699200000,"y":2891.3674955},{"x":1531785600000,"y":3352.14398492},{"x":1531872000000,"y":6502.00411376},{"x":1531958400000,"y":4399.37541578},{"x":1532044800000,"y":4474.42955162},{"x":1532131200000,"y":2782.16013981},{"x":1532217600000,"y":2567.01555589},{"x":1532304000000,"y":2908.11432834},{"x":1532390400000,"y":3982.42473573},{"x":1532476800000,"y":2784.76191564},{"x":1532563200000,"y":2282.20965433},{"x":1532649600000,"y":2335.26371962},{"x":1532736000000,"y":1334.69278327}];

var axisX = {};
var dataArray = [];
var sum = 0;
var currentYValue = 0;
var average = 0;
var data = [];
var dataSeries = { type: "column" };
var dataPoints = [];

dataPoints = dataSet;

dataSeries.dataPoints = dataPoints;
data.push(dataSeries);


var chart = new CanvasJS.Chart("chartContainer", {
  animationEnabled: true,
  zoomEnabled: true,
  rangeChanged: function(e){
    if(e.trigger === "zoom"){
      dataArray = [];
      minimum = chart.data[0].dataPoints[0].y;
      for( var i = 0; i<e.chart.data[0].dataPoints.length; i++ ){
        if(e.chart.data[0].dataPoints[i].x >= parseInt(e.axisX[0].viewportMinimum.toFixed(0)) && e.chart.data[0].dataPoints[i].x < parseInt(e.axisX[0].viewportMaximum.toFixed(0))){
          dataArray.push(e.chart.data[0].dataPoints[i].y);
          currentYValue = e.chart.data[0].dataPoints[i].y;
        }
      }
      performCalculations(dataArray, currentYValue);
    }

    if(e.trigger === "reset"){
      axisX.viewportMinimum = null;
      axisX.viewportMaximum = null;
      e.chart.render();
    }
  },
  theme: "dark2", // "light1", "light2", "dark1", "dark2"
  title:{
    text: "Binance Volume Analyser"
  },
    axisX:{
    title: ""
  },
  axisY:{
    title: "",
    titleFontColor: "#4F81BC",
    lineColor: "#4F81BC",
    labelFontColor: "#4F81BC",
    tickColor: "#4F81BC"
  },
  legend:{
    cursor: "pointer",
    dockInsidePlotArea: true,
    itemclick: toggleDataSeries
  },
  data: [{
      type: "line",
      name: "ADA Volume",
      markerSize: 0,
      toolTipContent: "Date: {x}<br>{name}: {y}",
      showInLegend: true,
      xValueType: "dateTime",
      dataPoints: dataSet
    }]
});
chart.render();


 function performCalculations(dataPointValue, currentValue){

  for( var j = 0; j<dataPointValue.length; j++ )
    sum = sum - (-dataPointValue[j]);
  average = sum / dataPointValue.length;

  document.getElementById("MinimumYValue").innerHTML = " Minimum Y Value "+ Math.min.apply(null, dataPointValue);
  document.getElementById("MaximumYValue").innerHTML = " Maximum Y Value "+ Math.max.apply(null, dataPointValue);
  document.getElementById("average").innerHTML = " Average value "+ average.toFixed(2);
  document.getElementById("currentValue").innerHTML = " Current Y Value "+ currentValue;
}
function toggleDataSeries(e){
  if (typeof(e.dataSeries.visible) === "undefined" || e.dataSeries.visible) {
    e.dataSeries.visible = false;
  }
  else{
    e.dataSeries.visible = true;
  }
  chart.render();
}
}
</script>
October 17, 2018 at 6:20 pm #23106We are looking into it and we will get back at the earliest.
__
Shashi Ranjan
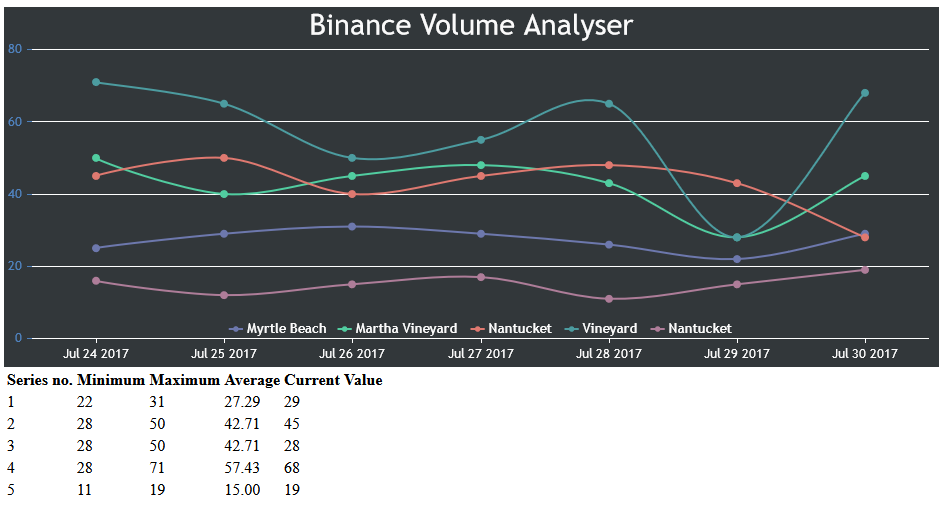
Team CanvasJSOctober 18, 2018 at 6:43 pm #23114You can loop through dataPoints of all the series to calculate the minimum, maximum & average values. Please find the code snippet below.
function performCalculations(dataPointValue, currentValue, seriesIndex) {
  sum = 0;
  for( var j = 0; j<dataPointValue.length; j++ )
    sum = sum - (-dataPointValue[j]);
  average = sum / dataPointValue.length;
  seriesIndex = seriesIndex + 1;

  $("tr:eq("+seriesIndex+") #td" + 0).html(seriesIndex)
  $("tr:eq("+seriesIndex+") #td" + 1).html(Math.min.apply(null, dataPointValue))
  $("tr:eq("+seriesIndex+") #td" + 2).html(Math.max.apply(null, dataPointValue))
  $("tr:eq("+seriesIndex+") #td" + 3).html(average.toFixed(2))
  $("tr:eq("+seriesIndex+") #td" + 4).html(currentValue)
}
Please take a look at this JSFiddle for complete code.

—
Vishwas R
Team CanvasJSOctober 18, 2018 at 7:04 pm #23115will it work if i increase series
October 22, 2018 at 10:08 am #23135Yes, it works even if you add few more dataSeries as it’s made generic to work with multi-series.
—
Vishwas R
Team CanvasJSOctober 22, 2018 at 12:54 pm #23146i have implemented it and it is working fine it solved my problem. But i am facing an issue, i want to add data series using a multiselect dropdown, when i select title names their respective data series should come from an ajax request. and previous data series should disappear. how can i do that.
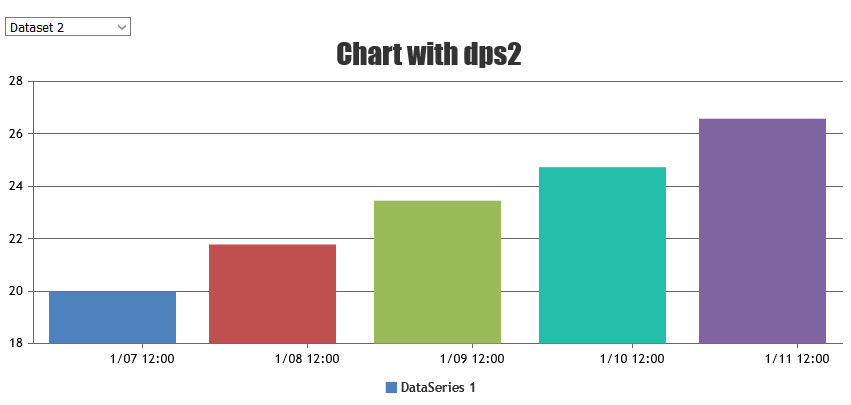
October 22, 2018 at 4:02 pm #23151You can render chart with dataPoints based on the values being selected from dropdown using change event. Below is the code-snippet for the same.
$(".dropdown").change(function() {
	chart.options.data[0].dataPoints = [];
  var e = document.getElementById("dd");
	var selected = e.options[e.selectedIndex].value;
  dps = jsonData[selected];
  chart.options.title = { text: "Chart with " + selected };
  for(var i in dps) {
  	var xVal = dps[i].x;
    chart.options.data[0].dataPoints.push({x: new Date(xVal), y: dps[i].y});
  }
  chart.render();
});
Please take a look at this JSFiddle for complete code.

But i am facing an issue, i want to add data series using a multiselect dropdown,
It would be helpful for us to understand your issue better when we look at your code working live in jsfiddle. So I request you to create jsfiddle reproducing the issue and share it with us.
—
Vishwas R
Team CanvasJSOctober 22, 2018 at 4:18 pm #23153i am using this script everything works fine until that click function runs. the data from ajax is ajax which gets selected multiple selection values…and show them in the chart
returning data is like this[{ type: "line", name: "ADA Volume", markerSize: 0, toolTipContent: "Date: {x}<br>{name}: {y}", showInLegend: true, xValueType: "dateTime", dataPoints: <?php echo json_encode($dataPoints1, JSON_NUMERIC_CHECK); ?> }….. and so on..
<script>
window.onload = function () {

var chart = new CanvasJS.Chart("chartContainer", {
	animationEnabled: true,
	zoomEnabled: true,
	rangeChanged: rangeChanged,
	theme: "dark2", // "light1", "light2", "dark1", "dark2"
	title:{
		text: "Binance Volume Analyser"
	},
		axisX:{
		title: ""
	},
	axisY:{
		title: "",
		titleFontColor: "#4F81BC",
		lineColor: "#4F81BC",
		labelFontColor: "#4F81BC",
		tickColor: "#4F81BC"
	},
	legend:{
		cursor: "pointer",
		dockInsidePlotArea: true,
		itemclick: toggleDataSeries
	},
	data: [{
		type: "line",
		name: "ADA Volume",
		markerSize: 0,
		toolTipContent: "Date: {x}<br>{name}: {y}",
		showInLegend: true,
		xValueType: "dateTime",
		dataPoints: <?php echo json_encode($dataPoints1, JSON_NUMERIC_CHECK); ?>
	},{
		type: "line",
		name: "BAT Volume",
		markerSize: 0,
		toolTipContent: "Date: {x}<br>{name}: {y}",
		showInLegend: true,
		xValueType: "dateTime",
		dataPoints: <?php echo json_encode($dataPoints2, JSON_NUMERIC_CHECK); ?>
	},{
		type: "line",
		name: "BCC Volume",
		markerSize: 0,
		toolTipContent: "Date: {x}<br>{name}: {y}",
		showInLegend: true,
		xValueType: "dateTime",
		dataPoints: <?php echo json_encode($dataPoints3, JSON_NUMERIC_CHECK); ?>
	}]
});
chart.render();
$("#mybtn").click(function(){
     var val = $('.selectpicker').val();
     var newSeries=$.ajax({

                type: 'GET',
                url: '/feature-4-chart.php',
                data: {"coins":val,},
                beforeSend: function(){
		        	$('#imagee').show();
			    },
			    complete: function(){
			        $('#imagee').hide();
			    },
	            success: function(data){
                //If the success function is execute,
                //then the Ajax request was successful.
                //Add the data we received in our Ajax
                //request to the "content" div.
				//newSeries= data.d.responseText;
				},
                error: function (xhr, ajaxOptions, thrownError) {
                    var errorMsg = 'Ajax request failed: ' + xhr.responseText;
                    $('.chartContainer').html(errorMsg);
                  }
            }).responseText;

    chart.options.data.push(newSeries);
    //chart.options.data[0].dataPoints.push({ x: 100, y: 14});
    chart.render();
});
 function rangeChanged(e) {
  var dpsInViewPort = [], currentYValue;
  $("#tr0").remove();$("#tr1").remove();$("#tr2").remove();
  for (var i = 0; i < e.chart.data.length; i++) {
    var row = $("<tr id='tr" + i + "'>");
    for(var j = 0; j < 5; j++){
      row.append($("<td id='td" + j +"'>"));
    }
    $('tr.email').after(row);
  }
  if(e.trigger === "reset") {
    for (var j = 0; j < e.chart.data.length; j++) {
    	dpsInViewPort = [];
      for (var i = 0; i < e.chart.data[j].dataPoints.length; i++) {
      	dpsInViewPort.push(e.chart.data[j].dataPoints[i].y);
      }
      currentYValue = e.chart.data[j].dataPoints[e.chart.data[j].dataPoints.length-1].y;
      performCalculations(dpsInViewPort, currentYValue, j);
    }
  }
  else {
    for (var j = 0; j < e.chart.data.length; j++) {
      dpsInViewPort = [];
      for (var i = 0; i < e.chart.data[j].dataPoints.length; i++) {
        if (e.chart.data[j].dataPoints[i].x >= parseInt(e.axisX[0].viewportMinimum.toFixed(0)) && e.chart.data[j].dataPoints[i].x < parseInt(e.axisX[0].viewportMaximum.toFixed(0))) {
          dpsInViewPort.push(e.chart.data[j].dataPoints[i].y);
          currentYValue = e.chart.data[j].dataPoints[i].y;
        }
      }
      performCalculations(dpsInViewPort, currentYValue, j);
    }
  }
}

function performCalculations(dataPointValue, currentValue, seriesIndex) {
  sum = 0;
  for( var j = 0; j<dataPointValue.length; j++ )
    sum = sum - (-dataPointValue[j]);
  average = sum / dataPointValue.length;
  seriesIndex = seriesIndex + 1;

  $("tr:eq("+seriesIndex+") #td" + 0).html(seriesIndex)
  $("tr:eq("+seriesIndex+") #td" + 1).html(Math.min.apply(null, dataPointValue))
  $("tr:eq("+seriesIndex+") #td" + 2).html(Math.max.apply(null, dataPointValue))
  $("tr:eq("+seriesIndex+") #td" + 3).html(average.toFixed(2))
  $("tr:eq("+seriesIndex+") #td" + 4).html(currentValue)
}
function toggleDataSeries(e){
	if (typeof(e.dataSeries.visible) === "undefined" || e.dataSeries.visible) {
		e.dataSeries.visible = false;
	}
	else{
		e.dataSeries.visible = true;
	}
	chart.render();
}

}
</script>
October 23, 2018 at 10:17 am #23171It would be helpful for us to understand your issue better if we could run the code locally at our end and try out the scenario you are talking about, but the code that you have shared is partial, which we can’t make it work at our end. So I request you to create sample project reproducing the issue you are facing along with sample data and share it with us over Google-Drive or Onedrive.
—
Vishwas R
Team CanvasJSOctober 24, 2018 at 11:36 am #23183can you please tell me that how can put a new data series on click event of a button.
i want that old data to be removed and new data to be inserted.
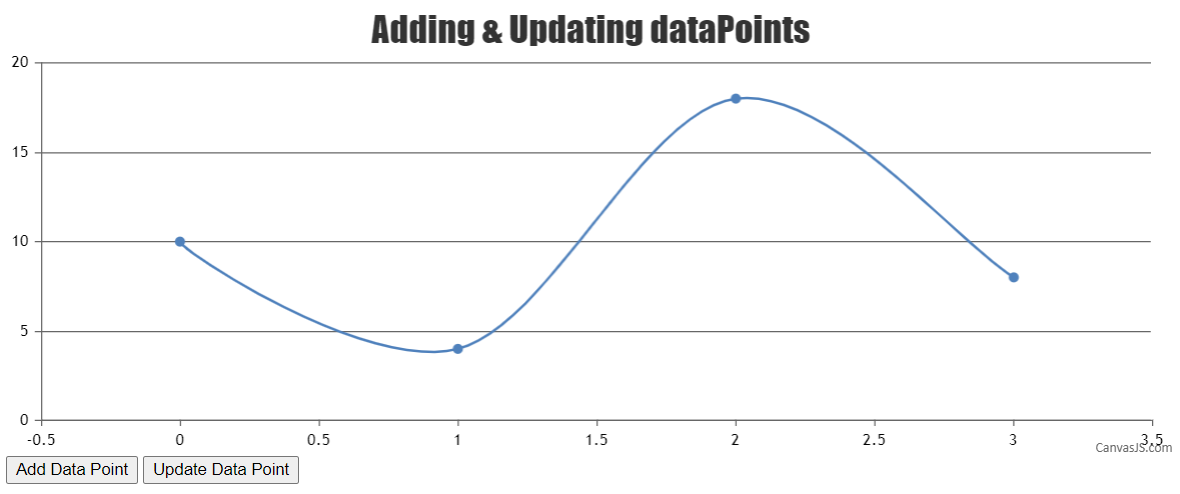
that’s allOctober 25, 2018 at 9:56 am #23197You can update chart options dynamically. Please take a look at documentation on Updating Chart Options and Data for the same.

In your case, you can just update dataPoints of same dataSeries rather than removing dataSeries and adding new one. Please take a look at this JSFiddle.
—
Vishwas R
Team CanvasJSOctober 25, 2018 at 3:25 pm #23201@Vishwas_R, your jsfiddle https://jsfiddle.net/canvasjs/k3wyfv2c/ is working fine enough, but it messed up when you change data series using ajax call.
here is an expamle please check this website. http://www.coinproof.co/feature-4/
Here i am using your js fiddle. it works nice if i use it for only 3 multiple data-series but if i use it for more than 3 it all get messed up and cannot work either.
Please check this http://www.coinproof.co/feature-4/
and provide me proper solution for thisOctober 26, 2018 at 12:06 pm #23210The link that you have shared seems to be working fine.
The JSFiddle that was shared earlier was adding 3 rows to the table which can be made generic to add number of rows based on number of dataSeries as shown in this updated JSFiddle.
—
Vishwas R
Team CanvasJSOctober 26, 2018 at 1:08 pm #23212@Vishwas R Thanks for your help. It worked for me and i am very happy with your solution. Just one thing i need in that graph.
Your given js fiddle works only when we drag reset or zoom in. But it doesn’t work when it loads. In other words i want that if a graph is loaded the table should automatically show their respective series data (while i call with ajax it should work too). if user do any actions on graph like drag or anything else than your function would work. Can you tell me that how can achieve that.October 26, 2018 at 1:31 pm #23213The method that calculates the minimum, maximum and other parameters is called only on rangeChanged event because of which table is populated only when you zoom/pan or reset the chart. To populate the table soon after rendering the chart, you need to call the method soon after chart.render().
chart.render();
showTableData(chart);
Please take a look at this Updated JSFiddle.
—
Vishwas R
Team CanvasJS
You must be logged in to reply to this topic.