Login to Ask a Question or Reply
You must be logged in to post your query.
Home › Forums › Chart Support › can we get series minimum and maximum value of datapoints
can we get series minimum and maximum value of datapoints
- This topic has 13 replies, 5 voices, and was last updated 7 years, 9 months ago by
Vishwas R.
-
February 17, 2018 at 11:06 am #19666February 19, 2018 at 10:18 am #19678
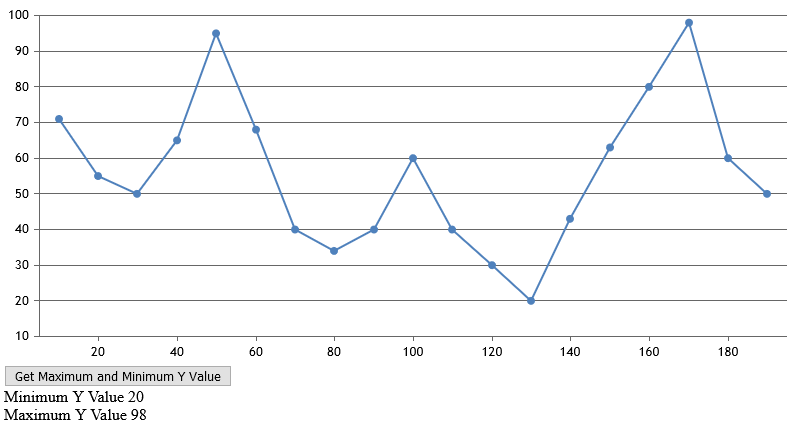
It is not possible to get the minimum and maximum y value in a series directly as of now. However, with few lines of code, you can achieve this. Please take a look at this JSFiddle.
___________
Indranil Deo,
Team CanvasJSSeptember 13, 2018 at 6:30 pm #22594Hi
is possible to draw max and min in chart with a stripline or similar?-
This reply was modified 7 years, 10 months ago by
jmnn.
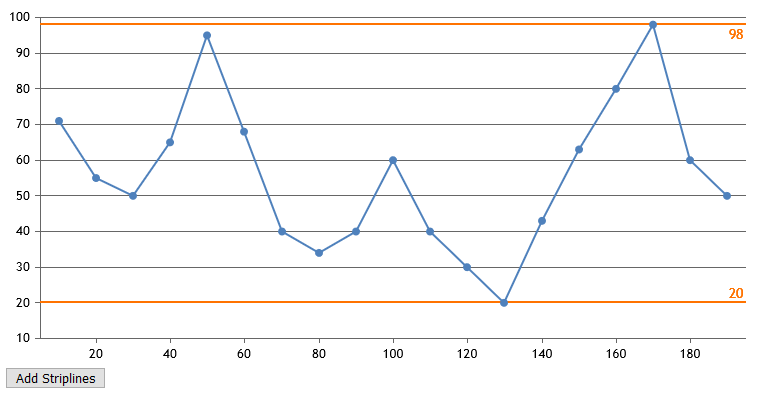
September 14, 2018 at 10:09 am #22598You can add striplines at minimum & maximum values dynamically by using addTo method. Please refer the code-snippet below.
chart.axisY[0].addTo("stripLines", { value: minY, label: minY, thickness:2 }, false);
chart.axisY[0].addTo("stripLines", { value: maxY, label: maxY, thickness:2 });
Please take a look at this JSFiddle. for complete code.
__
Priyanka M S
Team CanvasJSSeptember 15, 2018 at 1:40 pm #22609September 17, 2018 at 10:16 am #22623Yes, the same logic should work fine to add stripLines at the minimum and maximum dataPoints of a dynamically updating chart.
__
Priyanka M S
Team CanvasJSSeptember 17, 2018 at 1:19 pm #22628I’m sorry, the link was not shown in the previous message. I’ll write it again.
Thank you very much. It is ok. Congratulions!
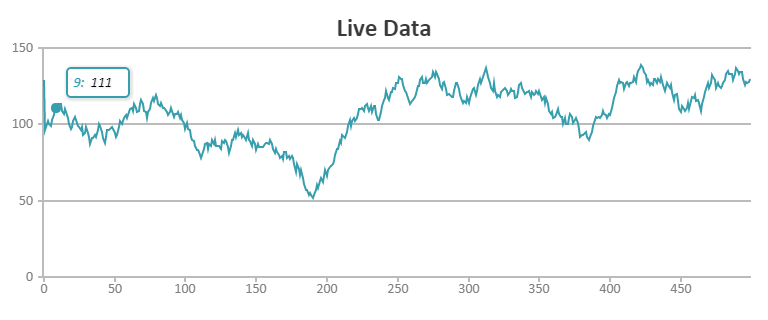
Last question. is possible to draw this chart but dinamics data? Link: https://canvasjs.com/html5-javascript-line-chart/ (see picture in archive http://prntscr.com/kv9sp9 ) Similar at striplines but pointing specifically to the datapoint (max and min). I understand that if know the datapoints, i can to indicate manually
{ y: 520, indexLabel: “highest”,markerColor: “red”, markerType: “triangle” },
{ y: 410 , indexLabel: “lowest”,markerColor: “DarkSlateGrey”, markerType: “cross” },
but i can not to draw the highest and lowest point when the data are dinamics. I can to draw the stripline with max and min but only points no.
Thanks for your help.
September 17, 2018 at 4:42 pm #22630You can calculate the minimum and maximum of dataPoints y-values after updating it dynamically and assign the desired markerType and stripLines to the lowest and highest dataPoint y-values as shown in this jsfiddle.
__
Priyanka M S
Team CanvasJSOctober 18, 2018 at 7:51 am #23109Thank you very much for your help. It was good for my job. I have it 99% completed. I just need the last step. I update the last point well but the crosshair does not update. I have used the length-1 option but the value of x is time and always has the value of the first point before updating. How could I update the crosshair?
I also thought about erasing the last datapoint and adding the new one, but I did not find the instructions to erase a datapoint. Can you give some solution?
Thanks for your helpLook Picture picture
October 18, 2018 at 9:49 am #23110How could I update the crosshair?
It would be helpful for us to understand your scenario better when we look at working code live in JSFiddle than guessing the issue by looking at screenshot. I request you to create JSFiddle reproducing the issue and share it with us.
I also thought about erasing the last datapoint and adding the new one, but I did not find the instructions to erase a datapoint. Can you give some solution?
Datapoints is an array. So you can remove last dataPoint using either pop method or splice method.
—
Vishwas R
Team CanvasJSOctober 19, 2018 at 4:52 am #23119Hi
Thanks for your helpI send you the code. The last price changes every 5 seconds, but only the price changes, the time is always the same, it does not change. (see crosshair)
The file structure is as follows:
1.- Data Historic Data ( 5 Datapoints)
2.- Actual Data (update1(chart)
3.- Update data (update2(chart)
This is an example.
The problem is in update2(chart). I have used the option (chart.options.data [0] .dataPoints [length-1] .y = price;)
to place the data in the right place but it does not serve to update the value of time and I have not found the solution for it for updating date/timeCode : jsfiddle.net
thanks for your help
-
This reply was modified 7 years, 9 months ago by
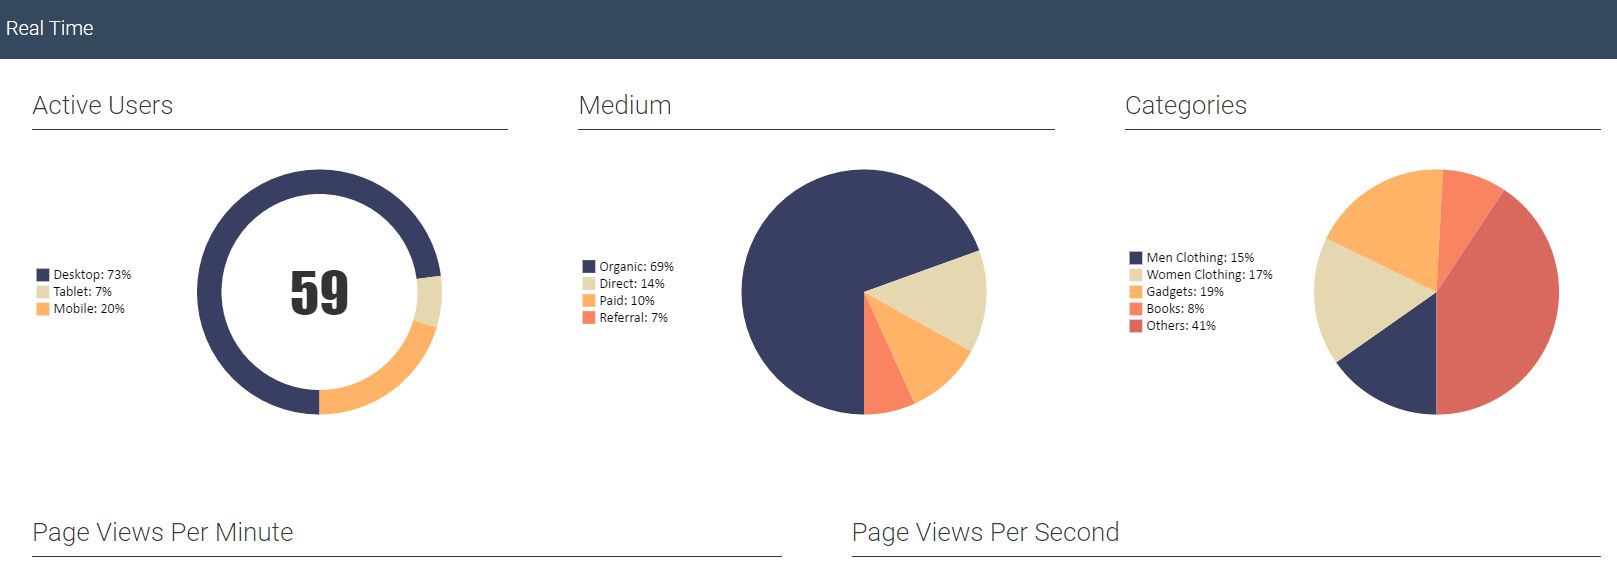
October 22, 2018 at 10:31 am #23137In update method, you are updating the last dataPoint’s y-value only and not x-value because of which x-value remains same and being shown in crosshair as such. Updating x and y-values should work fine in your case. To keep axis labels constant, please take a look at this sample dashboard. You can download the dashboards sample from our download page and try customizing and running locally.
—
Vishwas R
Team CanvasJS -
This reply was modified 7 years, 10 months ago by
You must be logged in to reply to this topic.