Login to Ask a Question or Reply
Forum Replies Created by Vishwas R
-
In case of numeric axis chart, labels will be shown at every interval of the axis. Because of this, it’s showing 1 & -1. If there is just one datapoint and your requirement is to show label just for datapoint, you can use category axis (use label instead of x-value). Please take a look at this JSFiddle for an example.
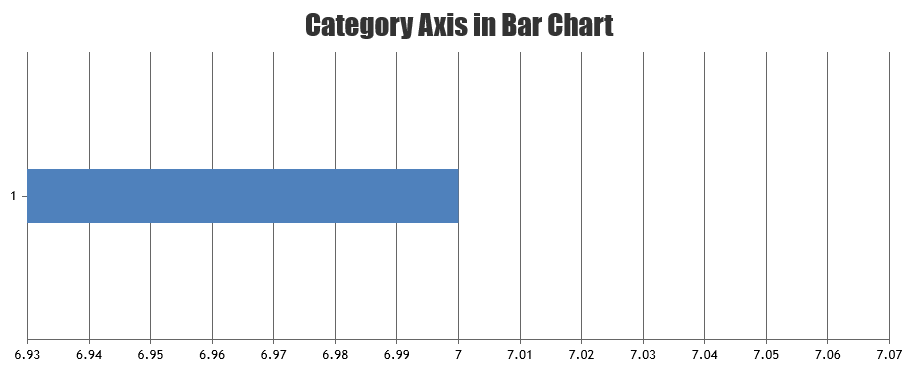
Considering this as duplicate of Single data row barcharts showing 1, -1 rows, hence closing the same.
—
Vishwas R
Team CanvasJSIn case of numeric axis chart, labels will be shown at every interval of the axis. Because of this, it’s showing 1 & -1. If there is just one datapoint and your requirement is to show label just for datapoint, you can use category axis (use label instead of x-value). Please take a look at this JSFiddle for an example.
—
Vishwas R
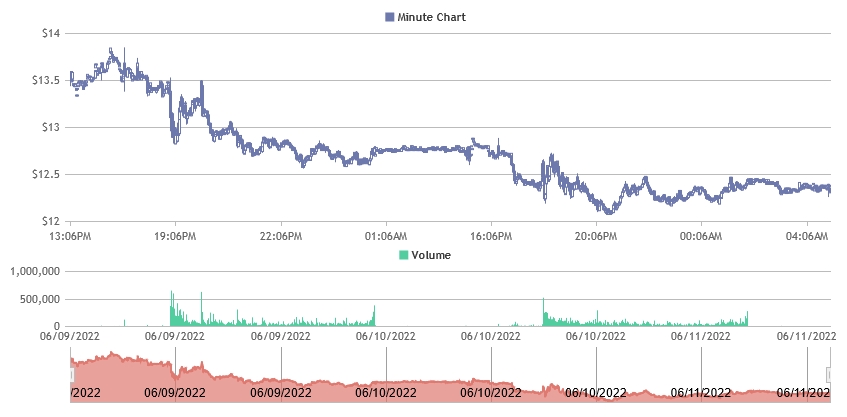
Team CanvasJSYou can align y-axis of both the charts so that the x-axis of both also gets aligned. This can be done by setting axis margin to top chart based on bounds of bottom chart.
chartTop.axisY[0].set("margin", (chartBottom.axisY[0].bounds.x2 - chartBottom.axisY[0].bounds.x1 - chartTop.axisY[0].bounds.x2 + 5));Please take a look at this updated JSFiddle for an example on the same.
Considering this as duplicate of Make transparent background, hence closing the same.
—
Vishwas R
Team CanvasJSYou can align y-axis of both the charts so that the x-axis of both also gets aligned. This can be done by setting axis margin to top chart based on bounds of bottom chart.
chartTop.axisY[0].set("margin", (chartBottom.axisY[0].bounds.x2 - chartBottom.axisY[0].bounds.x1 - chartTop.axisY[0].bounds.x2 + 5));Please take a look at this updated JSFiddle for an example on the same.
—
Vishwas R
Team CanvasJS[UPDATE]
@scroteau,We have released CanvasJS Chart v3.6.6 GA & StockChart v1.6.6GA with this bug fix. Please refer to the release blog for more information. Do download the latest version from download page & let us know your feedback.
—
Vishwas R
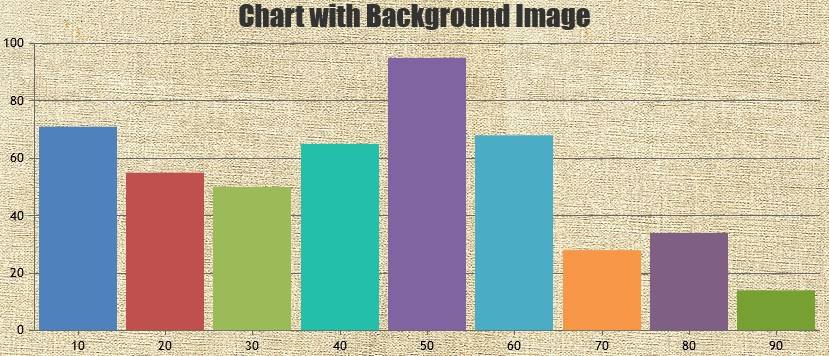
Team CanvasJSPlease take a look at this JSFiddle for an example on adding background image to the chart.
—
Vishwas R
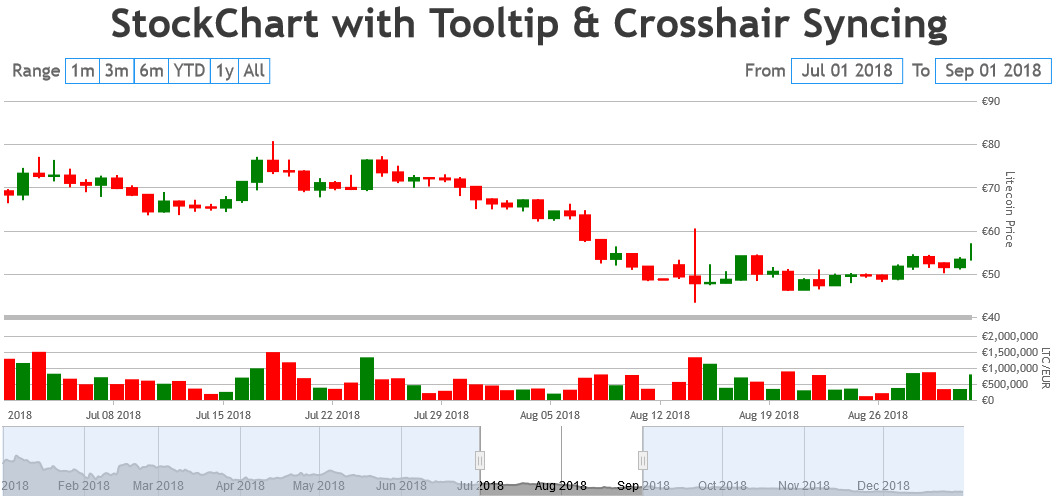
Team CanvasJSPlease take a look at this Gallery Page for an example on setting color based on datapoint close values in StockChart.
—
Vishwas R
Team CanvasJSYou are using value in labelFormatter instead of label, as you are passing date as label instead of x-value. Please find the updated code-snippet below.
labelFormatter: function(e) {
  return CanvasJS.formatDate(e.label, "HH:MMTT");
}
Please take a look at this updated JSFiddle for complete code.
—
Vishwas R
Team CanvasJSY-axis Striplines can be used to show a horizontal line at any desired value. You can set value property to 250 in your case. Please find the code-snippet below.
axisY: {
    stripLines: [{
        value: 250
    }]
}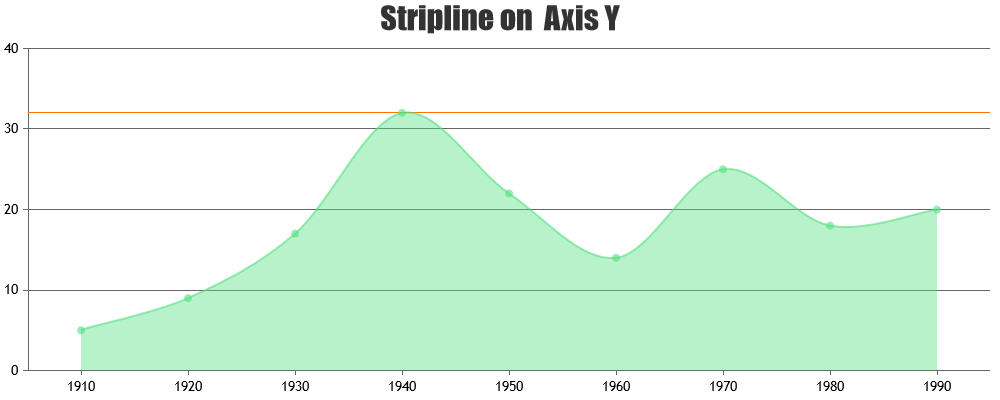
—
Vishwas R
Team CanvasJSSigi,
Datapoints will be plotted at it’s corresponding x and y values. When you increase the width / height of the chart, the corresponding x & y pixel-coordinates of a datapoint gets updated as per the latest size of the chart, but the value of that particular datapoint remains same.
If you are referring to some other issue, kindly brief us more about the same along with an example so that we can understand it better and help you out.
—
Vishwas R
Team CanvasJSYou can use markers to show circle, square, triangle or cross in line charts. Please refer to documentation for more information along with live examples that you can try out.
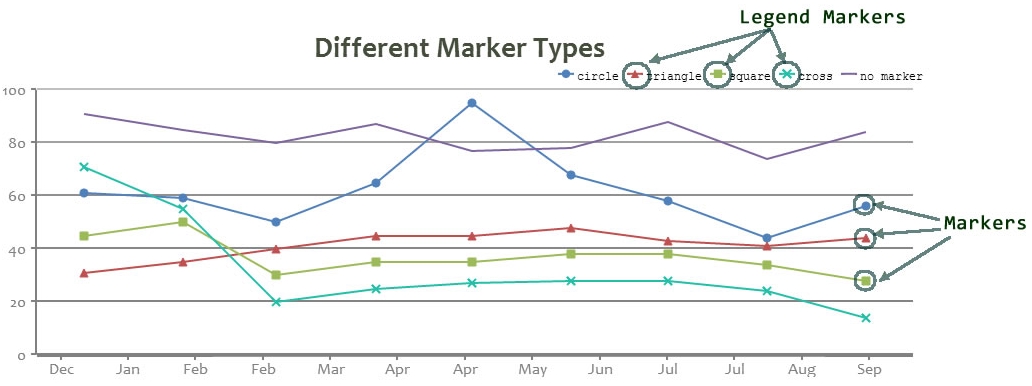
If this doesn’t fit your requirements can you kindly share some example or pictorial representation of what you are looking for so that we can understand your requirement better & help you out?
—
Vishwas R
Team CanvasJSRendering multiple charts in a page seems to be working fine in react. Please take a look at this Stackblitz for an example.
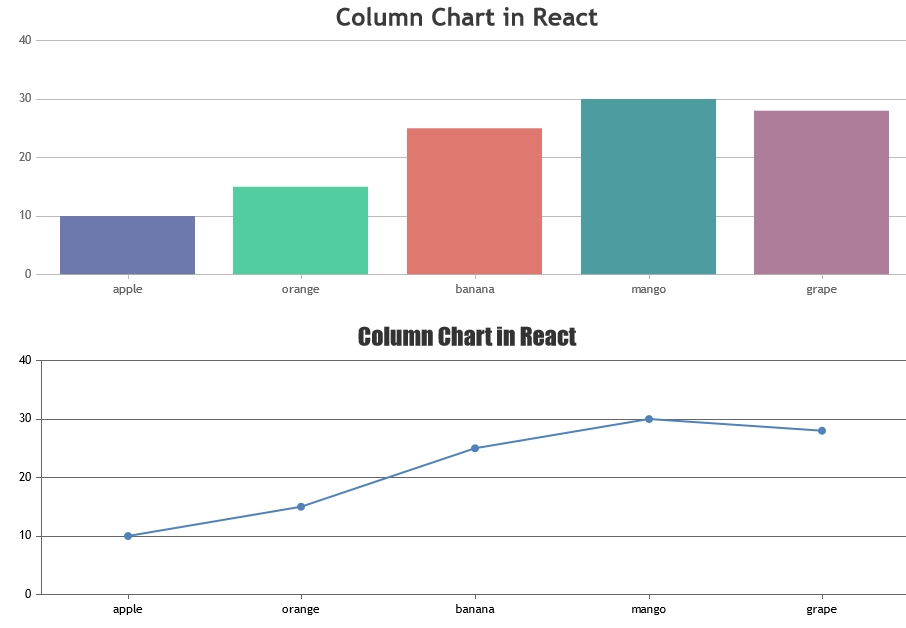
If you are still facing issue, can you kindly create a demo reproducing the issue & share it with us so that we can understand the scenario better and help you resolve?
—
Vishwas R
Team CanvasJSJune 9, 2022 at 6:33 pm in reply to: How to get if this version of library is licensed or not. #38037Sorry, it’s not possible to know if the version of library is licensed or unlicensed programmatically as of now. But it sounds like a good option to have, we will revisit the same for future versions.
—
Vishwas R
Team CanvasJSJune 7, 2022 at 7:25 pm in reply to: duplicate _containerId being generated when using CanvasJSREact #38002Matt,
We don’t have official npm package as of now. The package that you are using is a third-party one. Kindly download the official react-component from our download page. Please refer to this documentation page for step-by-step instruction on integration.
—
Vishwas R
Team CanvasJSJune 7, 2022 at 7:25 pm in reply to: How to get if this version of library is licensed or not. #38001CanvasJS commercial version doesn’t carry any watermark or credit link whereas trial version do. To download licensed version of CanvasJS, kindly login to My Account page with the registered mail from which you have purchased the license.
—
Vishwas R
Team CanvasJS