Home Forums Chart Support Tooltip not showing

Tooltip not showing

Viewing 7 posts - 1 through 7 (of 7 total)
  • #37668

    Hi,

    I have a chart with two lines. I don’t want to display one of the line details in the tooltip. So I tried contentFormatter. But if both line points have the same x-axis value then it won’t display the tooltip.

    I have sample jsfiddle with two lines. I want to show only one line detail in the tooltip. Is there any option in CavasJs to do this?

    #37679

    Ragu Nathan,

    You can set toolTipContent to null in dataseries level to hide tooltip for particular dataseries when shared is set to false. Please take a look at this JSFiddle for an example.

    However, the same can be done using contentFormatter as well. In this case, you will have to loop through all the entries & generate tooltip content to hide information related to one of the dataseries. Please find the code-snippet below.

    contentFormatter: (e) => {
      var content = "";
      for(var i = 0; i < e.entries.length; i++) {
        if (e.entries[i].dataSeries.name != "Visits") {
          content += e.entries[i].dataSeries.name + " - " +  e.entries[0].dataPoint.y;
        }
      }
      return content === "" ? null : content;  
    }

    Please take a look at this updated JSFiddle for complete code.
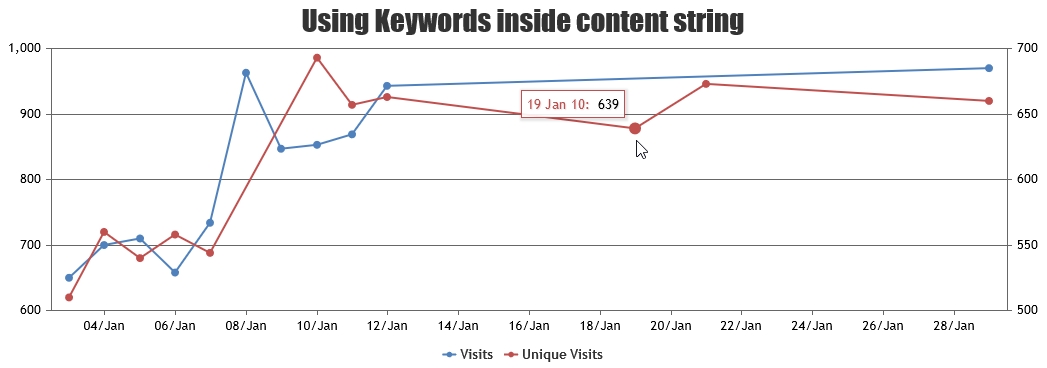
    Formatting Tooltip Content


    Vishwas R
    Team CanvasJS

    #37685

    Great. This solution working fine. But it would be great if you suggest an improvement. Is there any way to show the nearest line details in the tooltip when we hover over the disabled line data points?

    Please take a look at this jsFiddle. I have 3 lines in the chart. When we hover the mouse over the last data point of the Visits line (Blue line), I want to show a tooltip with the details of the other 2 lines nearest data points.

    #37705

    Great. It would be great if you suggest another improvement. I want to show the nearest chart data point details in the tooltip when we hover over the disabled chart line.

    Please take a look at this jsFiddle. I have 3 Chart lines. I want to show the nearest chart data point details when I hover over the last data point of the Visits line (Blue line). How can I achieve this?

    #37710

    Ragu Nathan,

    Sorry, it’s not possible to show tooltip for nearest datapoint when you hover a datapoint – even when tooltip is hidden for particular dataseries.


    Vishwas R
    Team CanvasJS

    #37713

    Thank you. Is there any workaround to achieve that? or any native way to hide the tooltip for particular data series?

    #37762

    Ragu Nathan,

    Tooltip can be hidden for particular dataseries by setting toolTipContent to null. In case of shared tooltip, setting toolTipContent to null will hide information related to that particular dataseries from the tooltip.


    Vishwas R
    Team CanvasJS

Viewing 7 posts - 1 through 7 (of 7 total)

You must be logged in to reply to this topic.