Home Forums Chart Support Assigning different colors on toolTip

Assigning different colors on toolTip

Viewing 2 posts - 1 through 2 (of 2 total)
  • #37322

    Hi, thank you so much for the previous help.
    I have one more inquiry.

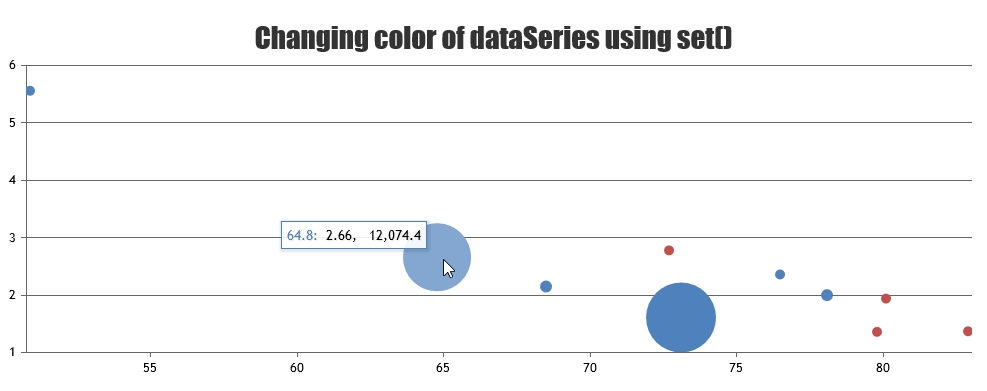
    I have a bubble chart with multiple categorizations – each category has a different colored bubble. It looks something like this:
    http://jsfiddle.net/canvasjs/snvwsjoo/

    Here, want the toolTip for each category to have a different color. For instance, I want to have a borderColor red for red bubbles, and borderColor blue for blue bubbles.

    How could I do this?

    Thank you!

    #37347

    @tiapoo,

    Tooltip accepts the color of datapoint as it’s border-color by default & it seems to be working fine. Please refer to the screenshot below.
    Chart Tooltip Border Color

    If you are still facing issue, can you kindly create JSFiddle & share it with us so that we can look into the code / chart-options being used, understand the scenario better and help you out?


    Vishwas R
    Team CanvasJS

Viewing 2 posts - 1 through 2 (of 2 total)

You must be logged in to reply to this topic.