Login to Ask a Question or Reply
Forum Replies Created by Vishwas R
-
You can use toolTip.content to achieve this.
Mahi,
Thanks for the information. We will check and get back to you at the earliest.
Gaurav,
You can use rangeSplineArea chart to show the range. If this doesn’t fulfill your requirement, pictorial or jsfiddle will help us understand better.
Gaurav,
You can use rangeSplineArea chart to show the range. If this doesn’t fulfill your requirement, pictorial or jsfiddle will help us understand better.
jbejarano,
Please download the commercial version from your account page. If you have done that already, please clear the browser cache and try again.
—
Vishwas RJelch,
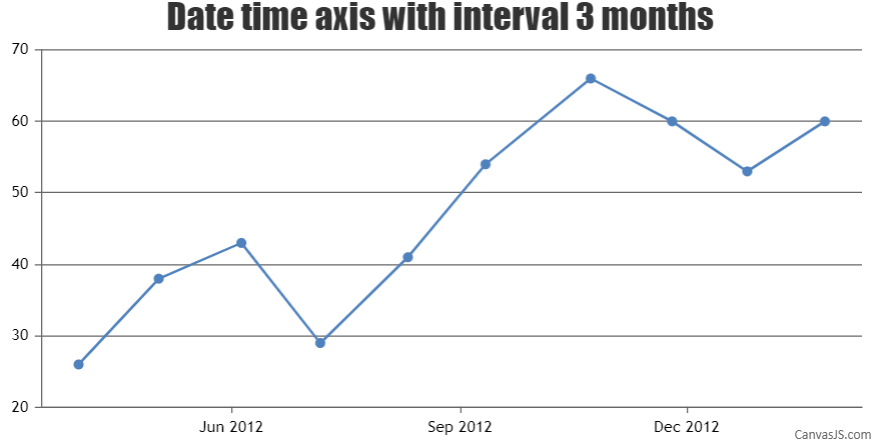
In JavaScript, date object is created using
new Date()but you are trying it usingdate(). Please refer this tutorial for the same. Here is the updated jsfiddle.Navinder,
Please refer to indexLabelFormatter documentation. You can use dataSeries, datapoint, index, total, percent, chart within indexLabelFormatter function. So when y-value is not 0, returning e.percent will fulfill your requirement. Here is the updated jsfiddle.
Navinder,
You can use indexLabelFormatter to achieve this. Please check this jsfiddle.
Mahi,
Sorry, its not possible to clip the chart. But the only work-around would be to place another div or element on top of chart by setting negative-margin to the next div. Check this example.
Jason,
v1.7.0 doesn’t have this feature. Please upgrade to use this feature.
Monirul,
We observed that the characters you have mentioned are supported and are working fine. Please check this jsfiddle. You can also use Unicode to represent the same.
Sandonet,
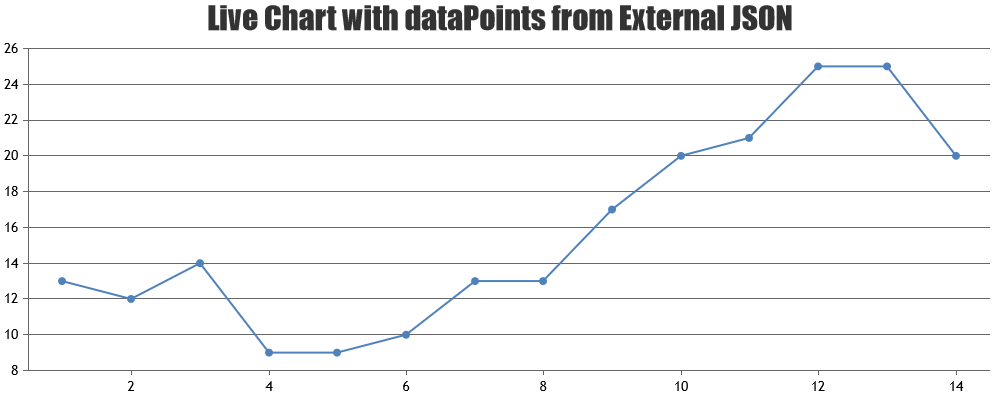
You seem to be passing wrong parameters to getJSON. Replacing
$.getJSON("test.json" + (dataPoints.length + 1) + (dataPoints[dataPoints.length - 1].y) + function(data)
with
$.getJSON("test.json", function(data) {in updateChart function should work fine. Please find the working code below.function updateChart() { $.getJSON("test.json", function(data) { $.each(data, function(key, value) { dataPoints.push({ x: parseInt(value[0]), y: parseInt(value[1]), z: parseInt(value[2]) }); }); chart.render(); setTimeout(function(){updateChart()}, 1000); }); }—
Vishwas R
Team CanvasJSSandonet,
Please refer to this documentation page for step-to-step tutorial on rendering live / dynamic chart with data from JSON.
—
Vishwas R
Team CanvasJS