Home Forums Chart Support Dynamic Chart Using Data From JSON File

Dynamic Chart Using Data From JSON File

Viewing 4 posts - 1 through 4 (of 4 total)
  • #12317

    Hi, i have a question how to make a dynamic chart but the data is coming from JSON file, this JSON data is updating every second.
    This is the example of the JSON data

    {"X":-2455, "Y":142, "Z":-110}

    I have searching everywhere but i didn’t find it, i only find dynamic chart with random data within.
    And one more thing, the X axis is showing the current time.

    Thanks for your attention, gladly waiting for an answer :)

    #12318

    Sandonet,

    Please refer to this documentation page for step-to-step tutorial on rendering live / dynamic chart with data from JSON.
    live chart with json data


    Vishwas R
    Team CanvasJS

    #12319

    Vishwas, i try this but not work, i’m sorry my js knowledge is not good, so can you give the example base on my code ?

    <!DOCTYPE HTML>
    <html>
    <head>
    <meta charset="utf-8"/>
    <script type="text/javascript">
    window.onload = function() {
    	var dataPoints = [];
    	var chart;
    	$.getJSON("test.json", function(data) {  
    		$.each(data, function(key, value){
    			dataPoints.push({x: parseInt(value)[0], y: parseInt(value[1]), z: parseInt(value[2])});
    		});
    		chart = new CanvasJS.Chart("chartContainer",{
    			title:{
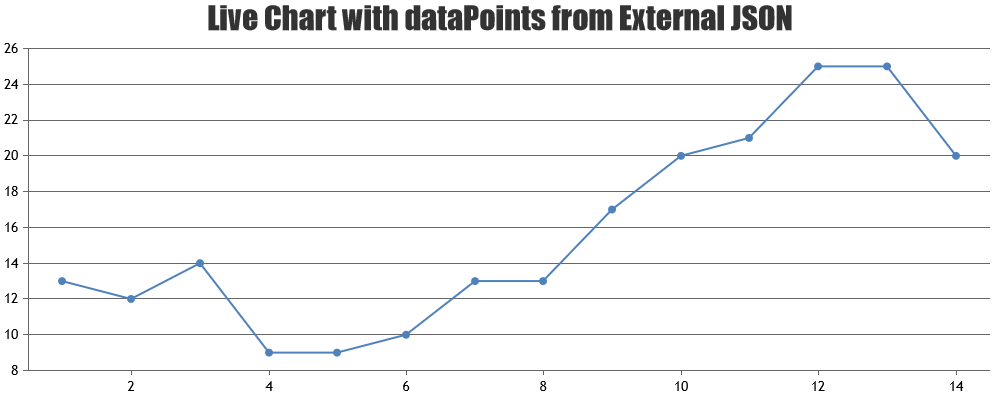
    				text:"Live Chart with dataPoints from External JSON"
    			},
    			data: [{
    				type: "line",
    				dataPoints : dataPoints,
    			}]
    		});
    		chart.render();
    		updateChart();
    	});
    	function updateChart() {
    	$.getJSON("test.json" + (dataPoints.length + 1) + (dataPoints[dataPoints.length - 1].y) + function(data) {
    		$.each(data, function(key, value) {
    			dataPoints.push({
    			x: parseInt(value[0]),
    			y: parseInt(value[1]),
    			z: parseInt(value[2])
    			});
    		});
    		chart.render();
    		setTimeout(function(){updateChart()}, 1000);
    	});
    	}
    }
    </script>
    <script type="text/javascript" src="https://canvasjs.com/assets/script/jquery-1.11.1.min.js"></script>
    <script type="text/javascript" src="https://cdn.canvasjs.com/canvasjs.min.js"></script>
    </head>
    <body>
    <div id="chartContainer" style="height: 300px; width: 100%;"></div>
    </body>
    </html>

    This is my json
    [[-2518,69,-192]]

    You can see my chart in here http://sne.dlinkddns.com:6060/html/node/Node/public/canpas.html
    Thank you very much

    #12325

    Sandonet,

    You seem to be passing wrong parameters to getJSON. Replacing
    $.getJSON("test.json" + (dataPoints.length + 1) + (dataPoints[dataPoints.length - 1].y) + function(data)
    with
    $.getJSON("test.json", function(data) { in updateChart function should work fine. Please find the working code below.

    function updateChart() {
    	$.getJSON("test.json", function(data) {
    		$.each(data, function(key, value) {
    			dataPoints.push({
    			x: parseInt(value[0]),
    			y: parseInt(value[1]),
    			z: parseInt(value[2])
    			});
    		});
    		chart.render();
    		setTimeout(function(){updateChart()}, 1000);
    	});
    }


    Vishwas R
    Team CanvasJS

Viewing 4 posts - 1 through 4 (of 4 total)

You must be logged in to reply to this topic.