Login to Ask a Question or Reply
Forum Replies Created by Thangaraj Raman
-
Thanks for your interest in CanvasJS and we appreciate you for bringing this to our notice.
As we are busy implementing some other important features at this point of time, we will re-look into this concern in future versions to improve our library further.
—
Thangaraj Raman
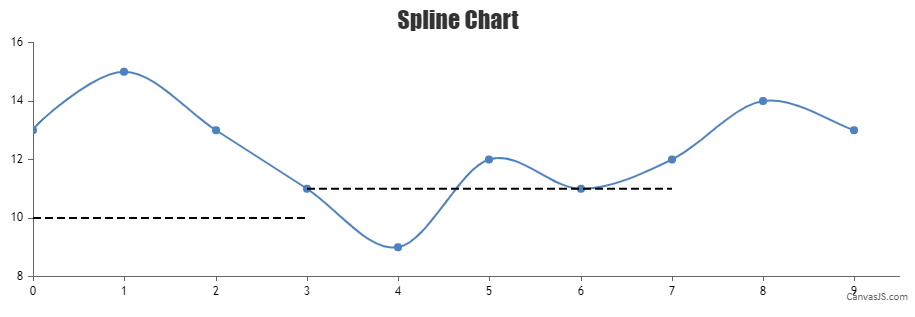
Team CanvasJSStrip Lines are used to highlight a certain region in the plot area across the full width/height of the chart and hence cannot have breakpoints. However, in your case, you can use a multi-series line chart with 2 dataPoints each to represent the start and end coordinates of the line.
Kindly take a look at this JSFiddle for a working example.
If the solution suggested doesn’t fulfill your requirement, kindly brief us further about your use case so that we can understand your scenario better and help you out with an appropriate solution.
—
Thangaraj Raman
Team CanvasJSAarvin,
The issue seems to be with the Date Format passed as an argument to
new Date(). Passing it in the standard formats supported in JavaScript Date object should work fine in your case.—
Thangaraj Raman
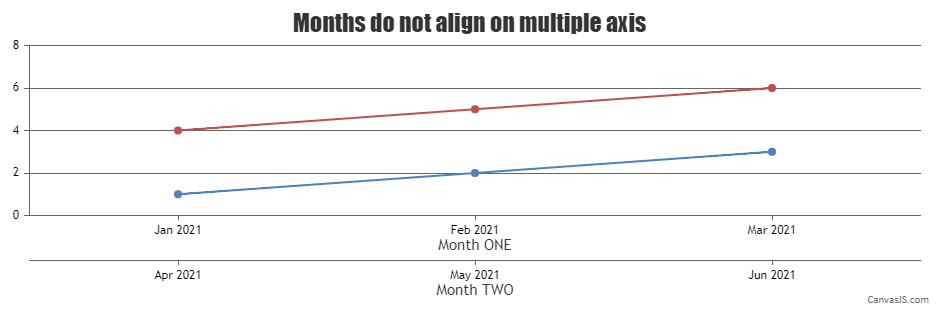
Team CanvasJSAs the number of days varies between months, axis labels cannot be aligned across multiple axes in the case of date-time values. However, in your example, you can use the label property instead of x value to align the labels on both axes.
Kindly take a look at this updated JSFiddle for a working example.
—
Thangaraj Raman
Team CanvasJSThe event parameter for rangeChanging and rangeChanged functions does not support preventDefault() method as of now. However, if you could kindly brief us further about your requirement, we will be able to understand your scenario better and help you out with an appropriate solution.
—
Thangaraj Raman
Team CanvasJSNovember 18, 2021 at 10:53 am in reply to: CanvasJS chart with signal peak loses xy zoom ability #36299Volker Voß,
We will reconsider this behavior and improve it in future releases.
—
Thangaraj Raman
Team CanvasJSLakshmi Venkateshappa,
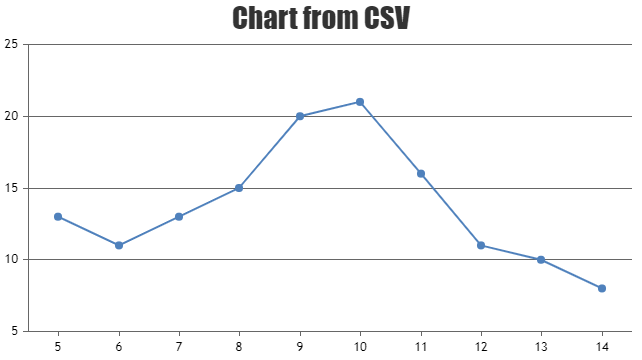
Please take a look at this JSFiddle for rendering the chart based on the CSV file that you have shared above.
If this does not meet your requirement, please share a pictorial representation and brief us further about the chart type and the specific columns from the CSV to be represented on the chart(over X and Y axis).
—
Thangaraj Raman
Team CanvasJSLakshmi Venkatappa,
To create a chart from CSV, you will have to get the CSV data using AJAX call and convert the same to CanvasJS supported format. Please check this documentation page for a step-by-step tutorial on the same.
The sample data that you have provided seems to be in JSON format. If you are looking to render a chart from JSON data please check this documentation page for a tutorial. However, if you are still facing issues in rendering the chart please share your sample data(CSV or JSON file) over Google-Drive or OneDrive so that we can analyze your data and help you out.
—
Thangaraj Raman
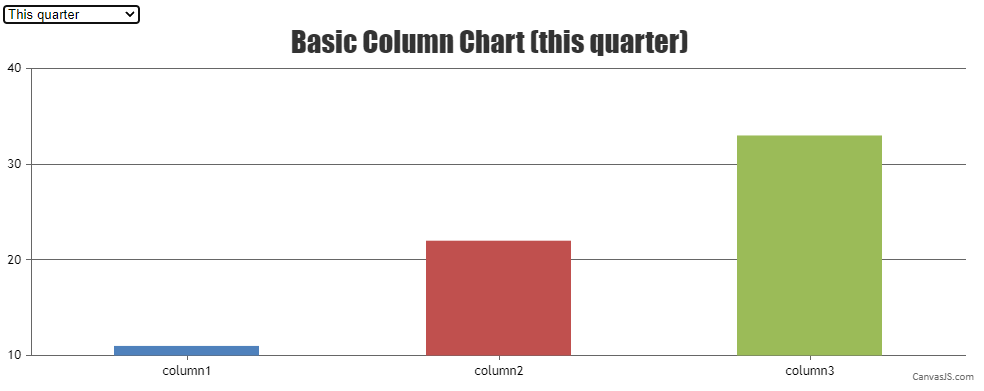
Team CanvasJSOctober 25, 2021 at 8:41 pm in reply to: Dynamically parse 2 separate JSON outputs for the same chart #36127You will have to create a separate chart container with a unique id for each chart. You can use the CSS display property to hide/unhide a chart based on the option selected from the dropdown menu.
Please take a look at this JSFiddle for a working example.
—
Thangaraj Raman
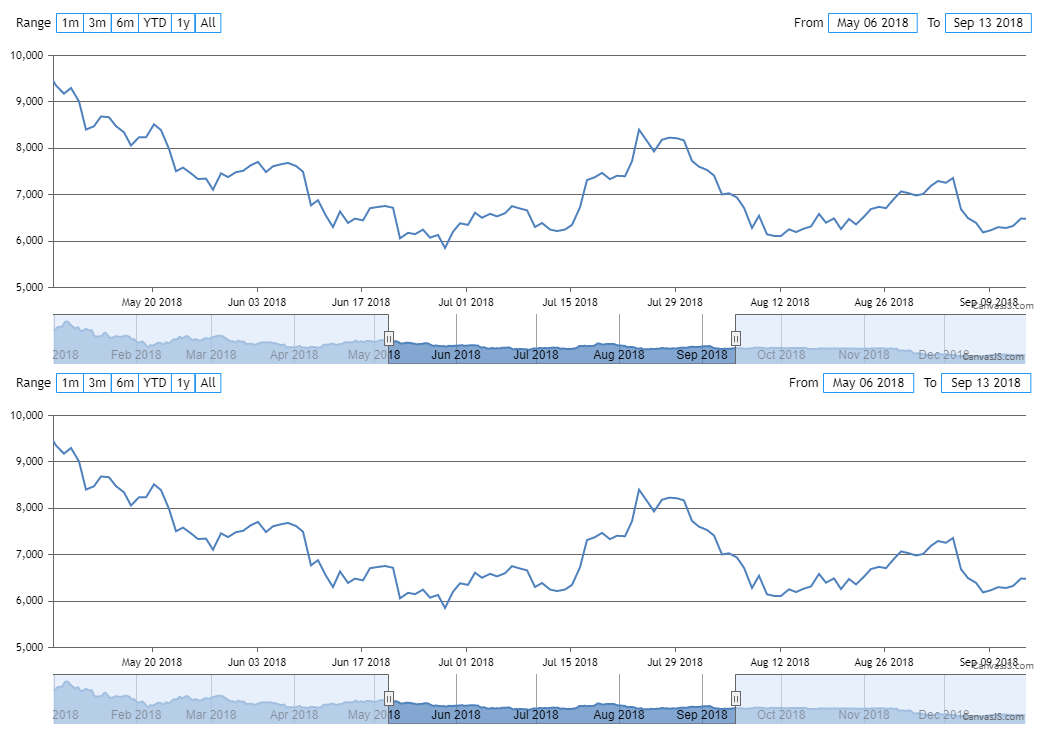
Team CanvasJSYou can use the rangeChanged event handler to sync the range of both the stockcharts when there is a change in the inputFields, rangeButtons or navigator. Please refer to the code snippet below:
function syncHandler(e) {
  for(i = 0; i < stockCharts.length; i++) {
    var stockChart = stockCharts[i];
    if(stockChart != e.stockChart) {
      stockChart.options.navigator.slider.minimum = e.minimum;
      stockChart.options.navigator.slider.maximum = e.maximum;
      stockChart.render();
    }
  }
}
Please take a look at this JSFiddle for working code.
—
Thangaraj Raman
Team CanvasJSThe datapoint y-value can only accept numeric values as of now. However, you can store a custom option (let’s say yLabel) for the song name and show the same in tooltip with the help of toolTipContent as shown in the code-snippet below.
array_push($dataPoints, array("x"=> strtotime($row['sch_date']) * 1000, "y"=> 1, "yLabel"=> $row['label']));
toolTipContent: "{x}: {yLabel}",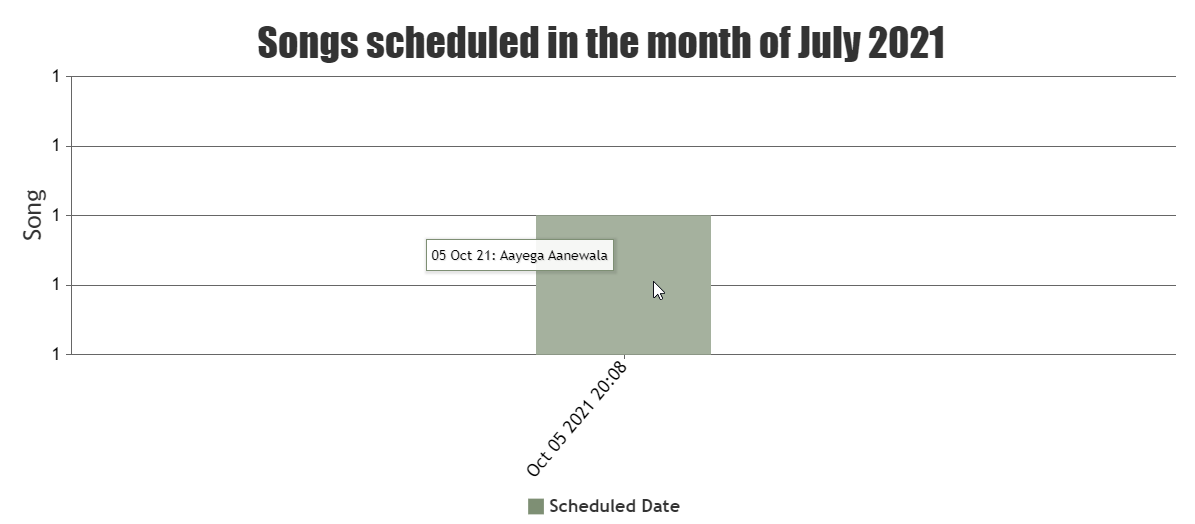
Please check this updated project for a working example.
—
Thangaraj Raman
Team CanvasJSNishant Chauhan,
Axis reversed property seems to be working fine in JS, JSP, etc. Can you kindly create a sample project reproducing the issue you are facing and share it with us over Google-Drive or OneDrive so that we can run it locally at our end, look into the code to understand the scenario better, and help you out?
—
Thangaraj Raman
Team CanvasJSAxis range and interval are auto-calculated based on datapoint values in the chart. However, it can be overridden by setting minimum, maximum, and interval properties for axisX or axisY.
Y axis values are not displayed at all.
Can you please create a sample project reproducing the issue you are facing and share it with us over Google-Drive or Onedrive along with the sample data/database so that we can look into the code, understand the scenario better and help you out?
—
Thangaraj Raman
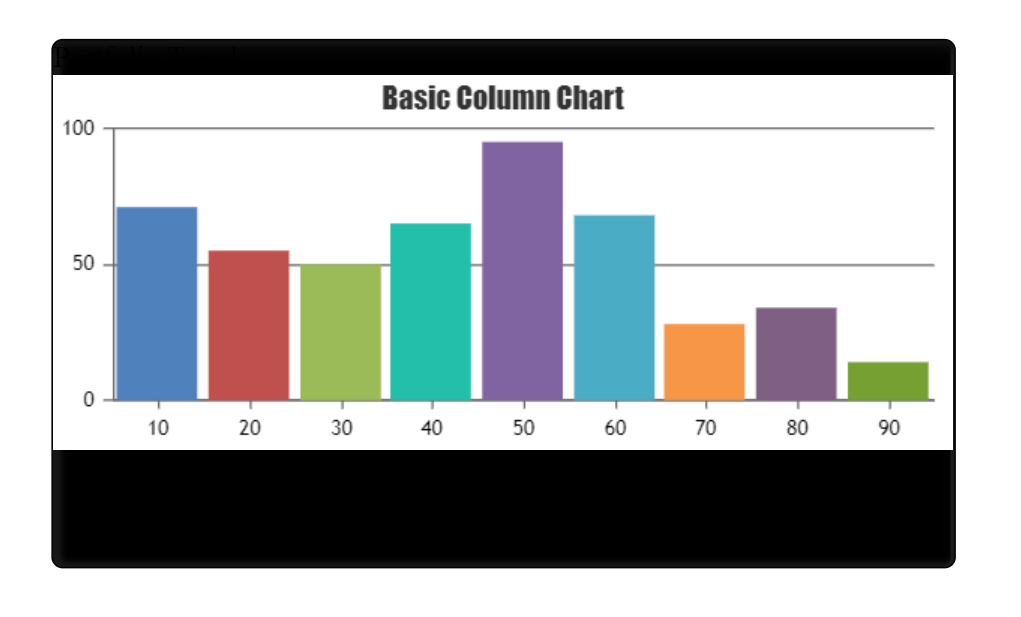
Team CanvasJSBased on the JSFiddle shared by you, calling chart.render() inside the click event handler after the class
expandedgraphis added to the DIV container seems to be working fine. Please check the below code snippet –$("#PortfolioTrend").click(function () { $("#zoom").addClass("expandedgraph"); chart.render(); })Also, please take a look at this JSFiddle for a working example.
—
Thangaraj Raman
Team CanvasJS