Home Forums StockChart Support link the rangeSelector of 2 graphs

link the rangeSelector of 2 graphs

Viewing 2 posts - 1 through 2 (of 2 total)
  • #36028

    Hi,
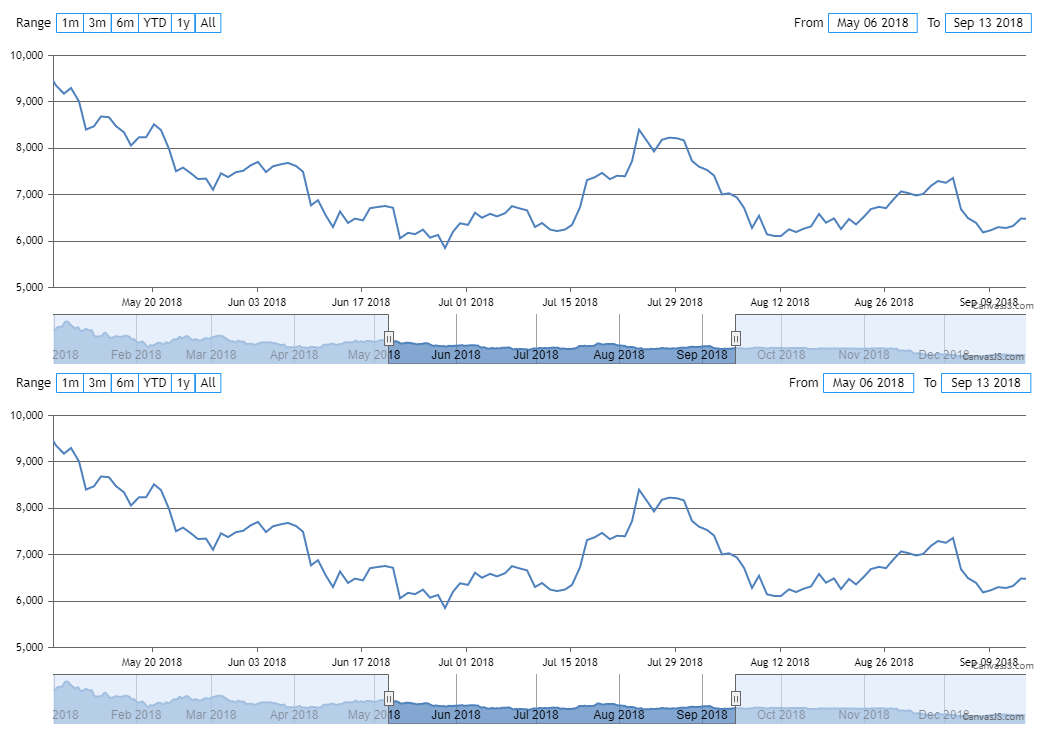
    here is what I want to do : I have 2 graphs. They both have the same x axis with the same dates. When I modify the date range of the first graph, I want the second graph to be also updated to match the date range of the 1st graph. I tried to doing so with those 2 lines, but it is not working :

    stockChartv5.options.rangeSelector.inputFields.startValue = stockChart.options.rangeSelector.inputFields.startValue;
    stockChartv5.options.rangeSelector.inputFields.endValue = stockChart.options.rangeSelector.inputFields.endValue;

    If possible, I’d like the button #5 to be selected by default (selectedRangeButtonIndex: 5)

    https://jsfiddle.net/ben551445/zn8u7o3p/5/

    thanks

    #36041

    @ben551445,

    You can use the rangeChanged event handler to sync the range of both the stockcharts when there is a change in the inputFields, rangeButtons or navigator. Please refer to the code snippet below:

    function syncHandler(e) {
      for(i = 0; i < stockCharts.length; i++) {
        var stockChart = stockCharts[i];
        if(stockChart != e.stockChart) {
          stockChart.options.navigator.slider.minimum = e.minimum;
          stockChart.options.navigator.slider.maximum = e.maximum;
          stockChart.render();
        }
      }
    }
    

    Please take a look at this JSFiddle for working code.

    StockChart with Synchronized range


    Thangaraj Raman
    Team CanvasJS

Viewing 2 posts - 1 through 2 (of 2 total)

You must be logged in to reply to this topic.