Home Forums Chart Support CanvasJS chart with signal peak loses xy zoom ability

CanvasJS chart with signal peak loses xy zoom ability

Viewing 8 posts - 1 through 8 (of 8 total)
  • #35018

    Hallo,
    I currently evaluate the CanvasJS chart for a web project and encounter a problem:
    If the CanvasJS chart contains a series with a signal peak the chart is losing its xy zooming ability.

    I created a jsfiddle to demonstrate a test case for this problem:
    https://jsfiddle.net/Volker_Voss_TechnoStep/p89qjbov/8/

    How can I solve this problem?

    Best regards,
    Volker Voß

    #35056

    Volker Voß,

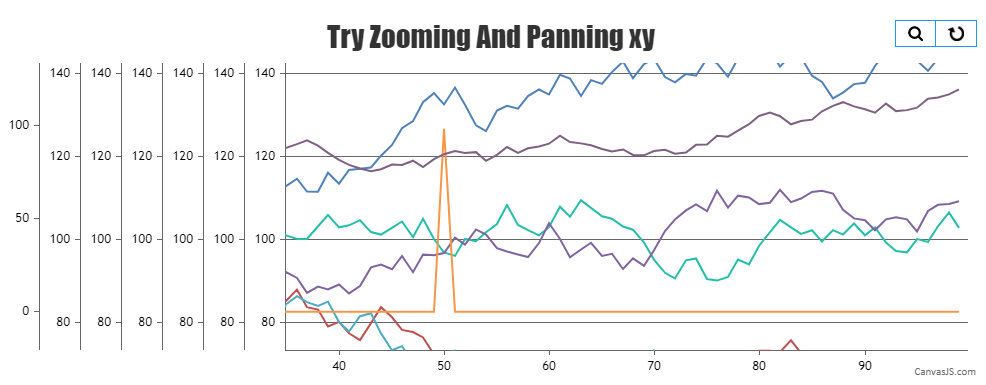
    The behavior is designed such that zooming is limited upto a certain region so that the user doesn’t end up zooming into a blank region (region with no dataPoints). To zoom into a certain region, there should be a minimum of 3-4 dataPoints over the axis.

    In your case, the zoom doesn’t work as there are less than 3-4 dataPoints with different values over the axisY in the signalPick dataSeries. We suggest you set the zoomType to x in such scenarios.

    If the solution suggested doesn’t fulfill your requirement, kindly brief us further about your use case so that we can understand your scenario better and help you out with an appropriate solution.


    Thangaraj Raman
    Team CanvasJS

    #35050

    Hallo,
    Quick update: The “y” zoom type is also affected by the peak signal. Only zoom type “x” is still working.

    I have updated the description text of the jsfiddle
    https://jsfiddle.net/Volker_Voss_TechnoStep/p89qjbov/31/

    Best regards,
    Volker Voß

    #35063

    Volker Voß,

    Based on your scenario you can assign the dataSeries with signalPeak values to an existing y-axis instead of creating a new y-axis by setting axisYIndex and it should work fine.

    Please take a look at this updated JSFiddle.

    Zooming with multiple Y-Axis


    Thangaraj Raman
    Team CanvasJS

    #35065

    Hallo Thangaraj,

    >Based on your scenario you can assign the dataSeries with signalPeak values to an existing y-axis
    >instead of creating a new y-axis by setting axisYIndex and it should work fine.
    Interesting workaround.
    Practical use may be difficult, because the signal curves will vary and the y axis are usually defined by customer.

    Best regards,
    Volker Voß

    #35078

    Volker Voß,

    As mentioned before, there is a restriction on the number of dataPoints required for zooming to work and we don’t have an option to remove this restriction as of now.


    Thangaraj Raman
    Team CanvasJS

    #36274

    Hallo Thangaraj,

    by request of my boss I would like to ask, if you have any plans to fix the xy zooming problem in this particular use case?

    Best regards,
    Volker Voß

    #36299

    Volker Voß,

    We will reconsider this behavior and improve it in future releases.


    Thangaraj Raman
    Team CanvasJS

Viewing 8 posts - 1 through 8 (of 8 total)

You must be logged in to reply to this topic.