Login to Ask a Question or Reply
You must be logged in to post your query.
Home › Forums › Chart Support › Date display on axis
Date display on axis
- This topic has 6 replies, 2 voices, and was last updated 4 years, 9 months ago by
shalkt.
-
September 17, 2021 at 1:48 am #35754
Hi,
I am retrieving data from mysql database and storing it in array using
while ($row = mysqli_fetch_assoc($db_sng_schqres)) {
array_push($dataPoints, array(“x”=> strtotime($row[‘schdt’]) * 1000, “y”=> $row[‘label’]));
}
Here the date value is displayed as 1627603200000 on the X-axis multiple times
If I format the datatime value using
axisX:{
valueFormatString: “DD-MMM” ,
} it displays only DD-MMM.
If I use xValueType: “dateTime” then the correct date is displayed. But as there is only 1 date in the database, that date is displayed. I want to display all the dates of the current month (or any month) to be displayed on the axis and then whatever value is retrieved from the database- display the column/bar at that particular date. How can I do this ?Y axis values are not displayed at all.
Thanks in advance.September 17, 2021 at 6:42 pm #35762Axis range and interval are auto-calculated based on datapoint values in the chart. However, it can be overridden by setting minimum, maximum, and interval properties for axisX or axisY.
Y axis values are not displayed at all.
Can you please create a sample project reproducing the issue you are facing and share it with us over Google-Drive or Onedrive along with the sample data/database so that we can look into the code, understand the scenario better and help you out?
—
Thangaraj Raman
Team CanvasJSSeptember 17, 2021 at 11:29 pm #35763Thanks Thangaraj Raman. I have uploaded the sample code on Google Drive but how do I share it ?
September 20, 2021 at 4:08 pm #35770October 5, 2021 at 7:38 am #35922Hi Thangaraj,
Please check the code at https://drive.google.com/file/d/1bbRpfRTxLSioP6pSfHJMouKlIx7QETHZ/view?usp=sharing
I tried various options from the forums. I want to display a song schedule – song vs date. The values are retrieved from the database.
1. I read that date values cannot be displayed on Y axis. I can display the date values on the X axis but the song names do not display on Y axis. It is blank and chart is not shown.
2. If I display song name on X axis, and using strtotime() on Y Axis the chart is drawn but the strtotime shows date in seconds(I guess) and not the actual date.Can you help me to display this ?
ThanksOctober 5, 2021 at 8:53 pm #35934The datapoint y-value can only accept numeric values as of now. However, you can store a custom option (let’s say yLabel) for the song name and show the same in tooltip with the help of toolTipContent as shown in the code-snippet below.
array_push($dataPoints, array("x"=> strtotime($row['sch_date']) * 1000, "y"=> 1, "yLabel"=> $row['label']));
toolTipContent: "{x}: {yLabel}",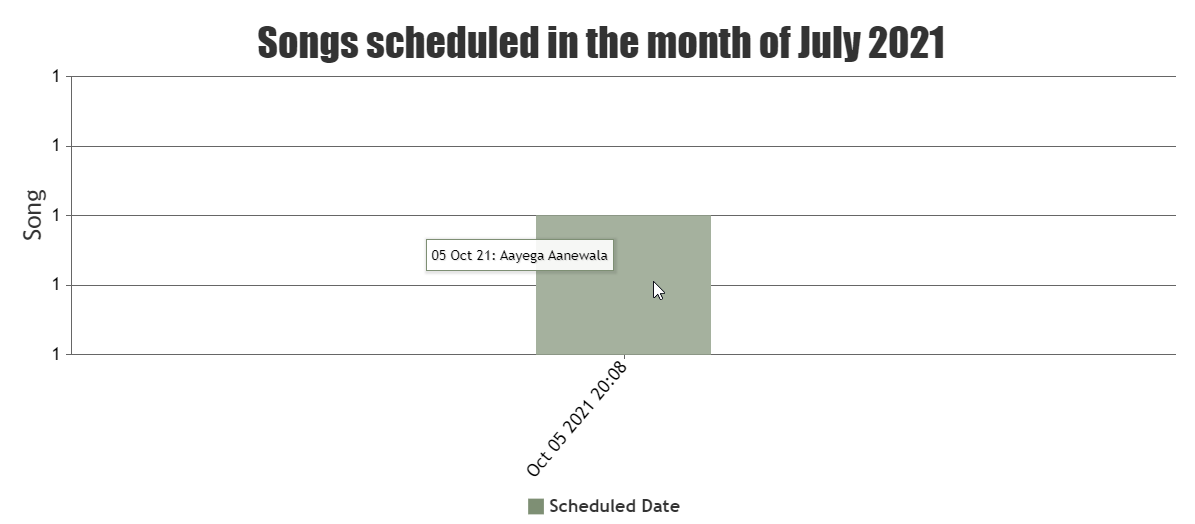
Please check this updated project for a working example.
—
Thangaraj Raman
Team CanvasJSOctober 5, 2021 at 11:10 pm #35937Thanks Thangaraj Raman.
I will try this and update the code accordingly.
You must be logged in to reply to this topic.