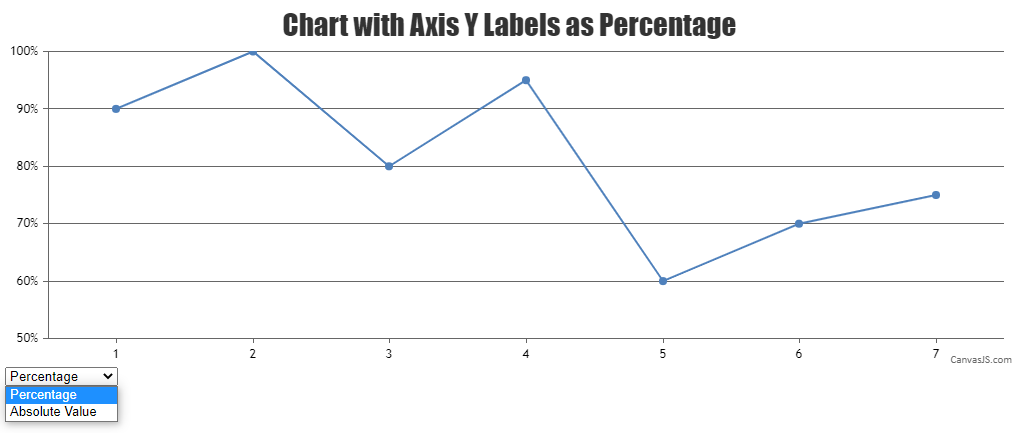
How do I show y-axis with data converted to percentage
- This topic has 1 reply, 2 voices, and was last updated 4 years, 10 months ago by
.
Viewing 2 posts - 1 through 2 (of 2 total)
Viewing 2 posts - 1 through 2 (of 2 total)
You must be logged in to reply to this topic.