Login to Ask a Question or Reply
Forum Replies Created by Thangaraj Raman
-
The interval at which axis labels are rendered is auto-calculated based on parameters like axis minimum, axis maximum, etc. However, you can override this by manually setting the interval property to show all labels.
—
Thangaraj Raman
Team CanvasJS.The interval at which axis labels are rendered is auto-calculated based on parameters like axis minimum, axis maximum, etc. However, you can override this by manually setting the interval property to show all labels.
—
Thangaraj Raman
Team CanvasJS.You can set the x-value as a date object instead of using labels.
To only display a certain number of recent dataPoints you can set the viewportMinimum according to the number of dataPoints you would like to view. Please find the code snippet for the same below.
chart.axisX[0].set("viewportMinimum", dps[0][dps[0].length - 1 - dpsInView].x)Please check this JSFiddle for a working example.
—
Thangaraj Raman
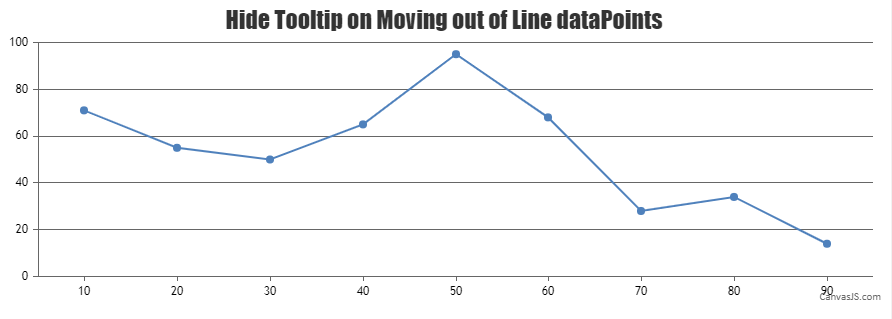
Team CanvasJSYou can set the mouseover and mouseout event handlers and create a custom function using the tooltip updated function to achieve the same behavior with a line chart. Please find the code snippet for the same below.
toolTip: {
  updated: function(e) {
    if(!showToolTip)
      e.chart.toolTip.hide();
  }
}
Please check this updated JSFiddle for a working example.
—
Thangaraj Raman
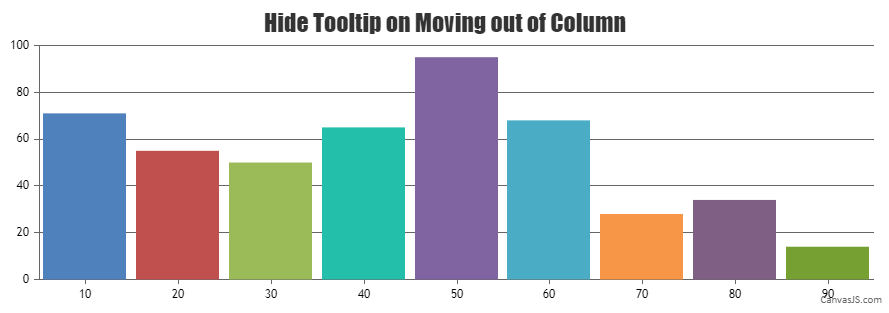
Team CanvasJSYou can use the tooltip hide() method within the dataSeries mouseout function to hide the tooltip when the mouse is moved away from the dataPoint. Please find the code snippet for the same below.
function onMouseout(e){
   e.chart.toolTip.hide();
}
Kindly take a look at this JSFiddle for a working example.
—
Thangaraj Raman
Team CanvasJSCan you kindly create JSFiddle reproducing the issue you are facing (with the custom export functionality) & share it with us so that we can look into the code / chart-options being used, understand the scenario better and help you out?
—
Thangaraj Raman
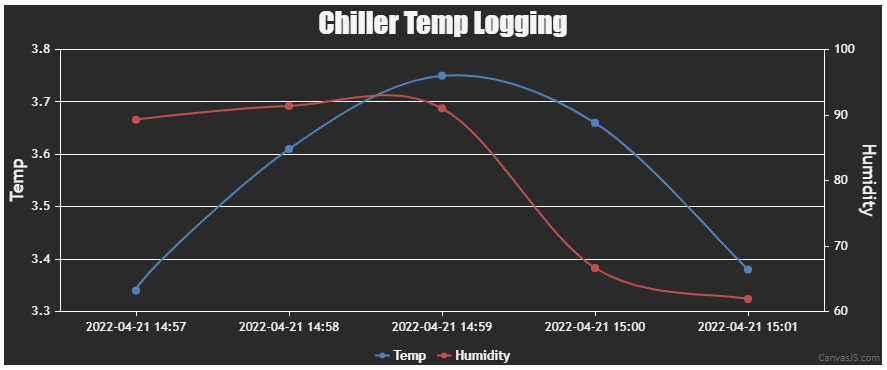
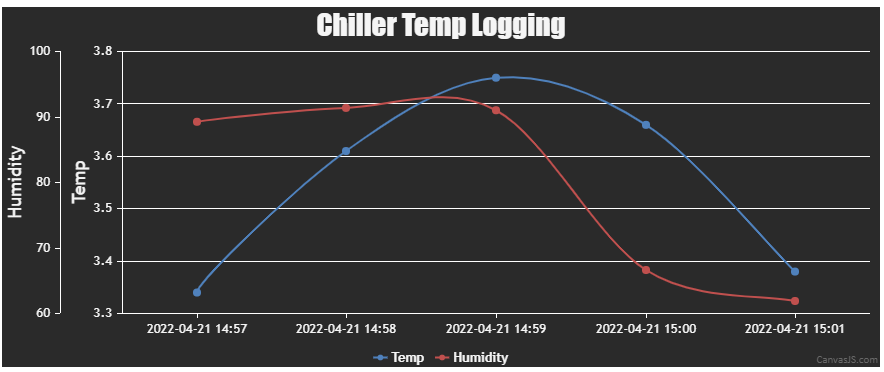
Team CanvasJSYou can set axisYType property as “secondary” for the humidity dataSeries to plot it against the secondary y-axis.
Kindly take a look at this updated JSFiddle for a working example.
—
Thangaraj Raman
Team CanvasJSIt is possible to create a multi-series chart with data from a CSV file. Please find the code snippet for the same below.
function getDataPointsFromCSV(csv) {
  var dataPoints, csvLines, points;
  dataPoints = csvLines = points = [];
  csvLines = csv.split(/[\r?\n|\r|\n]+/);
  for (var i = 1; i < csvLines.length; i++)
    if (csvLines[i].length > 0) {
      points = csvLines[i].split(",");
      chart.options.data[0].dataPoints.push({label: points[0], y: parseFloat(points[1])});
      chart.options.data[1].dataPoints.push({label: points[0], y: parseFloat(points[2])});
    }
}
Kindly take a look at this updated JSFiddle for a working example.
—
Thangaraj Raman
Team CanvasJSPlease take a look at this gallery page example on rendering minute-level data in the chart. You can change the chart type to “column” to achieve the same with a column chart however if you are looking to add a bar chart within the stock chart, it is not possible as of now.
—
Thangaraj Raman
Team CanvasJSApril 13, 2022 at 7:09 pm in reply to: Showing date in milliseconds for x-axis even if I pass date in correct format #37405In case there are no dataPoints to be rendered, you can add a dummy dataPoint by setting the x-value as axis-x minimum and y-value as 0 to achieve your requirement. Please find the code snippet for the same below.
function checkIfNoDataPoints() {
  for(var i = 0; i < chart.options.data.length; i++) {
    if(chart.options.data[i].dataPoints.length == 0) {
      chart.options.data[i].dataPoints.push({x:chart.axisX[0].get("minimum"), y:0, color: "transparent", toolTipContent: null, indexLabel: " "})
    }
  }
  chart.render();
}
Please take a look at this JSFiddle for a working example
—
Thangaraj Raman
Team CanvasJSCan you kindly create JSFiddle reproducing the issue you are facing & share it with us so that we can look into the code / chart-options being used, understand the scenario better and help you out?
From what we have observed, sometimes things get delayed mostly when we are not able to reproduce the issue or not able to understand the exact scenario, or the solution that we provide may not work properly due to the variation in chart options being used by you and us.
Having a JSFiddle helps us in figuring out the issue and suggesting an appropriate solution accordingly.
—
Thangaraj Raman
Team CanvasJSTooltip accepts the color of datapoint as it’s border-color by default & it seems to be working fine. Please refer to the screenshot below.
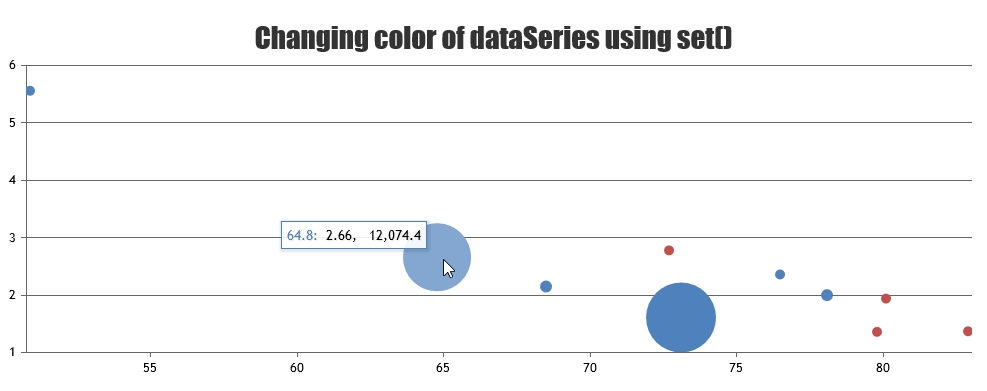
If you are still facing issue, can you kindly create JSFiddle & share it with us so that we can look into the code / chart-options being used, understand the scenario better and help you out?
—
Thangaraj Raman
Team CanvasJS2) Is it possible to pin(freeze) the y-axis when the chart is horizontally long which requires scrolling?
Please take a look at this JSFiddle for an example on freezing the y-axis and scrolling the chart horizontally along x-axis using jQuery-UI Slider.
If this doesn’t fulfill your requirement, could you please create a JSFiddle with your use-case and share it with us so that we can understand the scenario better and help you out?
—
Thangaraj Raman
Team CanvasJS1) I wonder if there is a way to set stroke color on the bubble of the bubble chart.
You can set markerBorderThickness and markerBorderColor to draw a border around the bubbles in a bubble chart.
2) Is it possible to pin(freeze) the y-axis when the chart is horizontally long which requires scrolling?
We are looking into this further & we will get back to you at the earliest.
—
Thangaraj Raman
Team CanvasJSYou can use the Range Selector in StockCharts to control the range of data being shown. Within the range selector, you can set the range and rangeType for range buttons to achieve your requirement.
—
Thangaraj Raman
Team CanvasJS