Login to Ask a Question or Reply
Forum Replies Created by Suyash Singh
-
October 9, 2017 at 11:08 am in reply to: chart object inside an array cause render() problems #17267
Can you kindly create a jsfiddle reproducing the issue you are facing, so that we can understand the issue better and help you out.
___
Suyash Singh
Team CanvasJS[update]
We have just released v2.0 GA with crosshair, 5 new chart types & several other features. Please refer the release blog for more information & let us know your feedback.
stripLines have a read only property called bounds which gives you the coordinates of the rectangular region bounded by the stripLine. get method can be used to access bounds. You can attach event based on bounds and achieve draggable stripLines. Please check this jsfiddle.
Also, is it possible to add id to striplines?
Yes, you can add custom properties like
idin stripLines object.Also please have a look at crosshair. Its a new feature available in v2.0 Beta which might be useful in your case.
—
Suyash Singh
Team CanvasJSMalik,
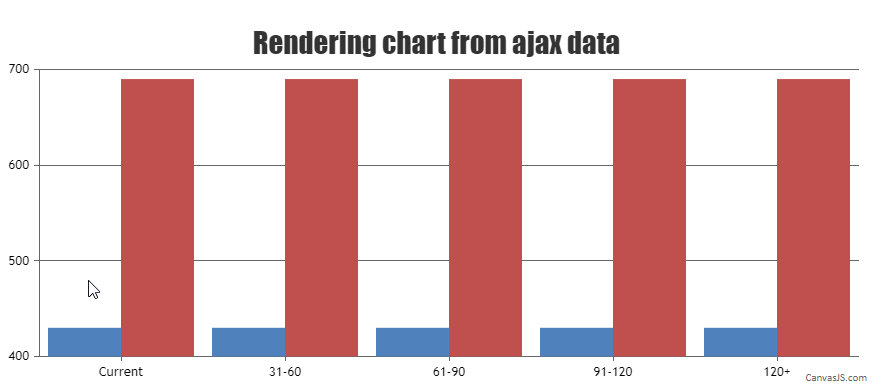
In the example provided it seems like chart is being rendered and then data is being parsed and added to the dataPoints array. The dataPoints are shown once if you press f12, due to chart.render() being called automatically while the window resizes (which is the defualt behaviour).
In order to render the chart with the dataPoints, you just have to call chart.render() inside the Ajax call.
Please take a look at the code snippet below,$.getJSON(“myfile.php”, function (result) { $.each(result[0], function (index, Info) { dataPoints_1.push({ x: Info.x, y: Info.y, label: Info.label }); }) $.each(result[1], function (index, Info) { dataPoints_2.push({ x: Info.x, y: Info.y, label: Info.label }); }) chart.render(); });
—
Suyash Singh
Team CanvasJSSeptember 30, 2017 at 10:05 am in reply to: Return X-axis values on Zoom Event in Parent Chart (1 of 2) #17200Please take a look at Syncing Multiple Charts using rangeChanged event.
——
Suyash Singh
Team CanvasJS[update]
We have just released v2.0 GA with axis scale-breaks, 5 new chart types & several other features. Please refer the release blog for more information & let us know your feedback.
We have just released v2.0 Beta 1 with axis scale-breaks, new chart-types, crosshair, and new themes. Please refer to the release blog for more information. Do download the latest version from our download page and let us know your feedback.
___
Suyash Singh
Team CanvasJS@cancanvas, @dragondgold, @fancidev,
[update]
We have just released v2.0 GA with crosshair, axis scale-breaks, 5 new chart types & several other features. Please refer the release blog for more information & let us know your feedback.
We have just released v2.0 Beta 1 with crosshair, new chart-types, axis scale-breaks and new themes. Please refer to the release blog for more information. Do download the latest version from our download page and let us know your feedback.
___
Suyash Singh
Team CanvasJS[update]
We have just released v2.0 GA with crosshair, 5 new chart types & several other features. Please refer the release blog for more information & let us know your feedback.
We have just released v2.0 Beta 1 with crosshair, axis scale-breaks, new chart-types, and new themes. Please refer to the release blog for more information. Do download the latest version from our download page and let us know your feedback.
___
Suyash Singh
Team CanvasJS[update]
We have just released v2.0 GA with axis scale-breaks, crosshair, 5 new chart types & several other features. Please refer the release blog for more information & let us know your feedback.
We have just released v2.0 Beta 1 with axis scale-breaks, new chart-types, crosshair, and new themes. Please refer to the release blog for more information. Do download the latest version from our download page and let us know your feedback.
___
Suyash Singh
Team CanvasJSSince you are reading data from the database, it would be helpful if you could share your sample project along with sample data via onedrive. It would help us in understanding your requirements better and help you out.
___
Suyash Singh
Team CanvasJSPlease have a look at labelFormatter and Formatting Date & Time. Also kindly go through Javascript Date-Time formats, since the format you are using might not work across all browsers.
___
Suyash Singh
Team CanvasJSUnless we look into your code, we can’t predict what went wrong in it. Can you kindly create a sample project and share your code, so that we can look into it and help you out.
___
Suyash Singh
Team CanvasJSThe jsfiddle that you have provided is a workaround of log scale on axisY.
Providing that as an input to that canvasjs library for drawing the graph. But I am not able to draw the graph. The below snippet is the one I have done.
Using the logarithmic scale on axisY completely depends on your requirement. From version 1.9.0 CanvasJS supports logarithmic scale on both axisX & axisY.
Please take a look on the documentation page on logarithmic axis for more info.
___
Suyash Singh
Team CanvasJS