Login to Ask a Question or Reply
You must be logged in to post your query.
Home › Forums › Chart Support › Chart Not Displaying
Chart Not Displaying
- This topic has 3 replies, 2 voices, and was last updated 8 years, 9 months ago by
ahsan.
Tagged: Chart Not Displaying
-
September 29, 2017 at 3:30 pm #17197
Hi
i am creating a chart dynamically using ajax
my ajax result is following[[{“label”:”Current”,”y”:430},{“label”:”31-60″,”y”:430},{“label”:”61-90″,”y”:430},{“label”:”91-120″,”y”:430},{“label”:”120+”,”y”:430}],[{“label”:”Current”,”y”:690},{“label”:”31-60″,”y”:690},{“label”:”61-90″,”y”:690},{“label”:”91-120″,”y”:690},{“label”:”120+”,”y”:690}]]
and i am retrieving this record
var dataPoints_1=[],dataPoints_2=[];
$(document).ready(function () {
$.getJSON(“myfile.php”, function (result) {
$.each(result[0], function (index, Info) {
dataPoints_1.push({
x: Info.x,
y: Info.y,
label: Info.label
});
});
$.each(result[1], function (index, Info) {
dataPoints_2.push({
x: Info.x,
y: Info.y,
label: Info.label
});
});
});
});window.onload = function () {
var chart = new CanvasJS.Chart(“chartContainer”,
{
theme: “theme3”,
animationEnabled: true,
title:{
text: “Chart Example”,
fontSize: 30
},
data: [
{
type: “column”,
name: “Chartbar1”,
legendText: “Chartbar1”,
showInLegend: true,
dataPoints : dataPoints_1
},
{
type: “column”,
name: “Chartbar2”,
legendText: “Chartbar2″,
showInLegend: true,
dataPoints : dataPoints_2
}],
legend:{
cursor:”pointer”,
itemclick: function(e){
if (typeof(e.dataSeries.visible) === “undefined” || e.dataSeries.visible) {
e.dataSeries.visible = false;
}
else {
e.dataSeries.visible = true;
}
chart.render();
}
},
});chart.render();
}
But chart is not showing up until i press F12 (turn on debugging OR i Press F5)
Waiting for reply
Thanks
MalikSeptember 30, 2017 at 10:19 am #17201Malik,
In the example provided it seems like chart is being rendered and then data is being parsed and added to the dataPoints array. The dataPoints are shown once if you press f12, due to chart.render() being called automatically while the window resizes (which is the defualt behaviour).
In order to render the chart with the dataPoints, you just have to call chart.render() inside the Ajax call.
Please take a look at the code snippet below,$.getJSON(“myfile.php”, function (result) { $.each(result[0], function (index, Info) { dataPoints_1.push({ x: Info.x, y: Info.y, label: Info.label }); }) $.each(result[1], function (index, Info) { dataPoints_2.push({ x: Info.x, y: Info.y, label: Info.label }); }) chart.render(); });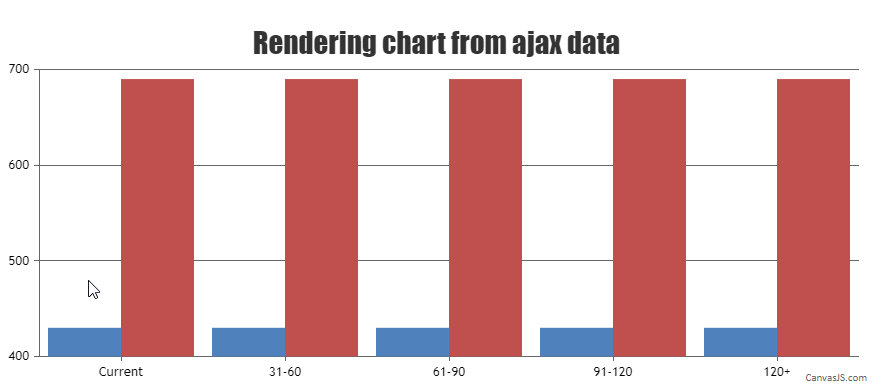
—
Suyash Singh
Team CanvasJSOctober 2, 2017 at 2:17 pm #17206Suyash,
Thanks for your reply i did same as you said and it works fine.
Thanks
Malik
Tagged: Chart Not Displaying
You must be logged in to reply to this topic.