Login to Ask a Question or Reply
Forum Replies Created by Indranil
-
Thanks for the suggestion. We will reconsider the behavior in future releases.
_________
Indranil Deo,
Team CanvasJSYou can try reducing the width of the indexLabel by setting indexLabelMaxWidth and indexLabelWrap, also you can try reducing the fontSize by setting indexLabelFontSize.
If in case it doesn’t suits your requirement can you please create a jsfiddle so that we can look into the code understand your case better and help you out.___________
Indranil Deo,
Team CanvasJS1. the re-render logic does not keep the range of the chart, it changes every time, which looks bad when toggle series on/off
This is an intended behavior, the axes range depends on the x and y-values of dataSeries shown. When a dataSeries is hidden, the range of the axes changes based on the x and y-values of the dataSeries visible.
2. When all data series removed, re-render will even refuse to render the coordinate system.
As there are no dataSeries to be shown the axes won’t be associated with any dataSeries hence there won’t be any range.
Still, setting the minimum and maximum for the axes will work fine in your case. Please take a look at this jsfiddle.
___________
Indranil Deo,
Team CanvasJSFebruary 5, 2018 at 11:27 am in reply to: Click on legend is not working in Dynamic / Live Multi Serie Chart #19310We are still trying to reproduce the issue at our end but it seems to be working fine. Can you please try disabling the hardware acceleration, in chrome settings as suggested in this forum thread.
___________
Indranil Deo,
Team CanvasJSCan you please check if y value of the dataPoints received from php service is of type number? In case the issue still persists after converting the y value to number please create a JSFiddle reproducing the issue and share it with us along with sample data so that we can look into the code, understand the scenario better and help you out.
___________
Indranil Deo,
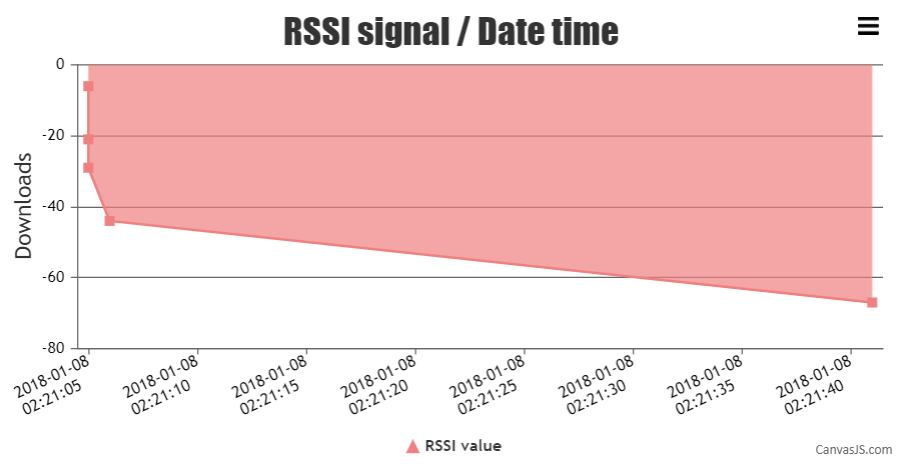
Team CanvasJSBased on the sample data shared by you the Date passed to the dataPoints is not in standard format. Instead, passing the Date in the standard JavaScript DateTime format
new Date("2018-01-07T20:51:05.000Z")will work fine in your case. Below is a sample dataPoint –{ x: new Date("2018-01-07T20:51:05.000Z"), y: -6 }Also, kindly take a look at this JSFiddle for a working sample.

___________
Indranil Deo
Team CanvasJSFebruary 1, 2018 at 8:31 pm in reply to: Click on legend is not working in Dynamic / Live Multi Serie Chart #19276We tested it on macOS 10.13.3 with Chrome Version 64.0.3282.119 based on the use case mentioned by you, the chart seems to be working fine.
Can you please provide your hardware details like Processor, Graphics Card.
Also, please check the Chrome Devtools for any errors being thrown.
___________
Indranil Deo,
Team CanvasJSLegend color can be customized by setting the legendMarkerColor to the desired color.
___________
Indranil Deo,
Team CanvasJSAdding CSS property white-space: pre-wrap to the div in toolTipContent will work fine in your case. Please take a look at this jsfiddle.
___________
Indranil Deo,
Team CanvasJSJanuary 31, 2018 at 11:12 am in reply to: Click on legend is not working in Dynamic / Live Multi Serie Chart #19197The above-mentioned chart seems to be working fine in Chrome.

Can you please share your OS and browser details(version) also check if there are any errors being thrown in Chrome Devtools.
___________
Indranil Deo,
Team CanvasJSYes, you can display iso week number with the help of labelFormatter. Please take a look at this jsfiddle.
___________
Indranil Deo,
Team CanvasJSYou can’t make AJAX requests to the local filesystem due to security issue. As a workaround, you can store the file on a local webserver and make an AJAX call to it or you can store the JSON in CORS enabled JSON hosting service like myjson.com.
____________
Indranil Deo,
Team CanvasJSYou can position custom DOM element on top of chart with the help of convertValueToPixel and convertPixelToValue methods. Please take a look at this jsfiddle.
___________
Indranil Deo,
Team CanvasJS