Login to Ask a Question or Reply
You must be logged in to post your query.
Home › Forums › Chart Support › Time axis with valueFormatString not working
Time axis with valueFormatString not working
- This topic has 5 replies, 2 voices, and was last updated 5 years, 3 months ago by
Indranil.
Tagged: time axis
-
February 1, 2018 at 6:34 pm #19241
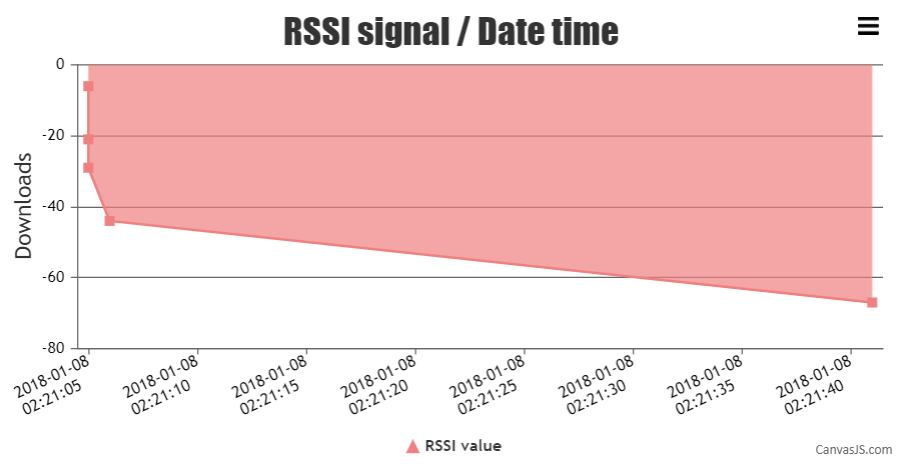
Hi I want to render a time axis chart,
var chart = new CanvasJS.Chart("rssi",{
		exportEnabled: true,
		zoomEnabled: true,
		title:{
			text:"RSSI signal / Date time"
	     },
	     axisX: {
        	intervalType: "hour",
        	valueFormatString: "YYYY-MM-DD HH:mm:ss",
        	labelMaxWidth: 100, // change label width accordingly
      	    },
	    axisY: {
	        title: "Downloads"
	    },
		data: [{
			type: "area",
			name:" RSSI value",
			showInLegend: true,
			xValueType: "dateTime",
			markerType: "square",
			color: "#F08080",
			dataPoints : dataPoint
		}]
	});
	chart.render();
Here is my datapoints:
0: Object { x: Date 2018-01-07T20:51:41.000Z, y: -67 }
1: Object { x: Date 2018-01-07T20:51:05.000Z, y: -6 }
2: Object { x: Date 2018-01-07T20:51:05.000Z, y: -21 }
3: Object { x: Date 2018-01-07T20:51:05.000Z, y: -29 }
4: Object { x: Date 2018-01-07T20:51:06.000Z, y: -44 }
https://screenshots.firefox.com/2QL0FQlVN0walVDx/null-
This topic was modified 8 years, 5 months ago by
ahmedcharef.
February 2, 2018 at 10:33 am #19284Based on the sample data shared by you the Date passed to the dataPoints is not in standard format. Instead, passing the Date in the standard JavaScript DateTime format
new Date("2018-01-07T20:51:05.000Z")will work fine in your case. Below is a sample dataPoint –{ x: new Date("2018-01-07T20:51:05.000Z"), y: -6 }Also, kindly take a look at this JSFiddle for a working sample.
___________
Indranil Deo
Team CanvasJSApril 22, 2021 at 4:14 pm #34063Hello,
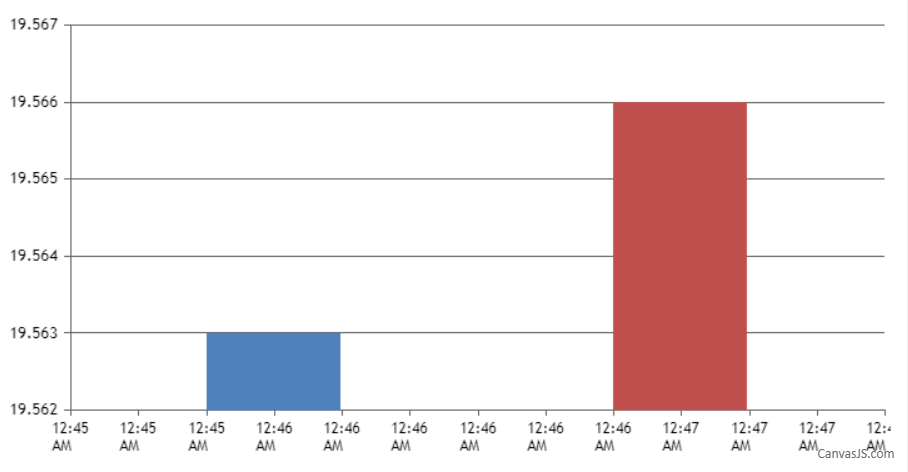
I am using multiseries line chart. In that valueFormatString: “hh:mm TT” for x-axis labels is used and also label is added to datapoints.
so sometimes its taking labels and sometimes valueFormatString.for example, for below timestamps its taking labels of datapoints as a x-axis labels
“data”: [{
“x”: 1619032560000,
“label”:”Apr-22-2021 00:46″,
“y”: “19.563”,
}, {
“x”: 1619032620000,
“label”:”Apr-22-2021 00:47″,
“y”: “19.566”,
}and for below data its taking valueFormatString for x-axis label format,
“data”: [{
“x”: 1606377256000,
“label”:”Nov-22-2021 00:46″,
“y”: “-99.159”,
}, {
“x”: 1606377616000,
“label”:”Nov-22-2021 00:47″,
“y”: “-134.617”,
}
I am converting timestamp into standard javascript date-time format, new Date(x)so can u please explain on what value it depends ?
April 23, 2021 at 5:27 am #34078valueFormatString sets how values must be formatted before they appear on Axis X and it is not applied for dataPoints label property. In your case, you can set the xValueType to dateTime for displaying date-time using the timestamp provided in x-value and format the same using valueFormatString as shown in the code snippet below –
axisX: {
  valueFormatString: "hh:mm TT"
},
data: [{
  xValueType: "dateTime",
  dataPoints: [
    {
      x: 1619032560000,
      //label:"Apr-22-2021 00:46",
      y: 19.563,
    }, {
      x: 1619032620000,
      //label: "Apr-22-2021 00:47",
      y: 19.566,
    }
  ],
}
]
Also, please take a look at this JSFiddle for a working example.
___________
Indranil Deo
Team CanvasJSApril 23, 2021 at 2:52 pm #34083Hi Indranil,
Thanks for the explanation. But my doubt is why the behavior is different for both the datapoints.
Please take a look at this jsfiddle. In this example try “datapoints1” and “datapoints2” and check x-axis labels, you will see for datapoints1 its using label property and for datapoints2 its formatting by “valueFormatString”. So as per my understanding for both the cases it should consider “valueFormatString” not label value.-
This reply was modified 5 years, 3 months ago by
Malvi Panchal.
-
This reply was modified 5 years, 3 months ago by
April 26, 2021 at 6:25 pm #34117Labels are rendered at every interval on the axis and not to every dataPoint. For datapoints2 the label is not shown at the specific dataPoint whereas, it is shown for datapoints1 as the label for datapoints1 falls at the specific interval. Hence, there is a difference in the axis labels being shown for both the dataPoints set.
___________
Indranil Deo
Team CanvasJS -
This topic was modified 8 years, 5 months ago by
Tagged: time axis
You must be logged in to reply to this topic.