Login to Ask a Question or Reply
Forum Replies Created by Indranil
-
Setting the reversed property to true for axis Y will work fine in your case. Please take a look at this updated jsfiddle.
___________
Indranil Deo,
Team CanvasJSMarch 13, 2018 at 10:33 am in reply to: multi-series within multi-chart and together control zoom. #198981.Can i active crosshair axisX on each chart at same time?
Please take a look at this jsfiddle to Sync crosshair across multiple charts.
2.Can i get the value of different between axis X two point ?
Do you mean to calculate the difference by selecting the two dataPoints? You can select dataPoints on click as shown in this jsfiddle.
___________
Indranil Deo,
Team CanvasJSYou can introduce extra dataPoints at the beginning and at the end of the dataSeries with y-value 0 and x-value between the last dataPoint of previous dataSeries and first dataPoint of the next dataSeries.
Please take a look at this updated JSFiddle.

___________
Indranil Deo,
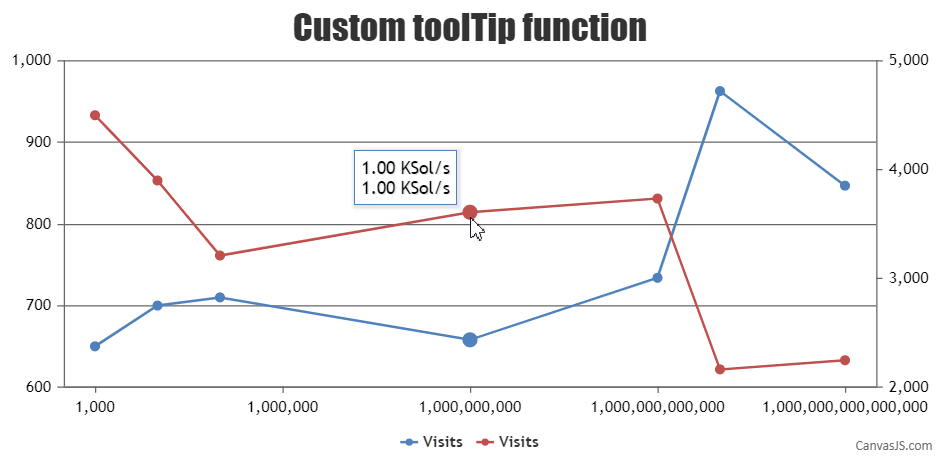
Team CanvasJSWhen shared property of toolTip is set to true it lists all the dataPoints of corresponding x-value for each dataSeries. You can loop through the entries to get all dataPoints of corresponding x-value in contentFormatter as shown in the code snippet below –
function contentFormatter(e){
  var content = " ";
  for (var i = 0; i < e.entries.length; i++) {
    var hashrate = e.entries[i].dataPoint.x;
    if (hashrate < 1000000) {
      content += (Math.round(hashrate / 1000) / 1000 ).toFixed(2)+' Sol/s';
      content += "<br/>";
    }
    else {
      var byteUnits = [ ' Sol/s', ' KSol/s', ' MSol/s', ' GSol/s', ' TSol/s', ' PSol/s' ];
      var j = Math.floor((Math.log(hashrate/1000) / Math.log(1000)) - 1);
      hashrate = (hashrate/1000) / Math.pow(1000, j + 1);
      content += hashrate.toFixed(2) + byteUnits[j];
      content += "<br/>";
    }
  }
  return content;
}
Also, please take a look at this JSFiddle for a working sample.

___________
Indranil Deo
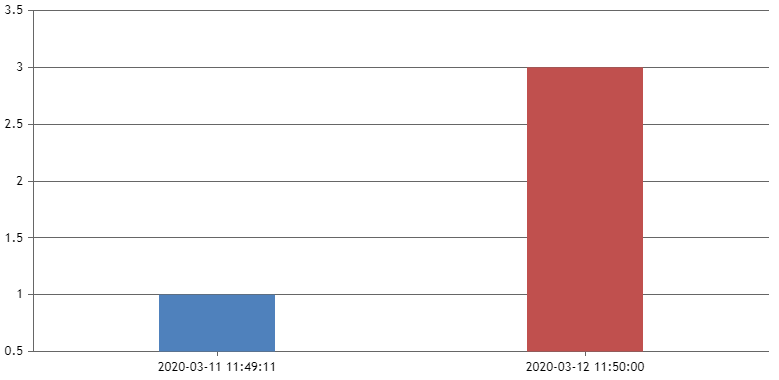
Team CanvasJSMarch 12, 2018 at 11:45 am in reply to: Creating Dynamic Graphs on a PHP page based off MySQL data #19892Based on the sample project shared by you the SQL query used seems to have some issues. Comparing timestamp properly should work fine in your case, i.e.
SELECT timestamp, count FROM skelCount WHERE timestamp >= TIMESTAMP(DATE_SUB(NOW(), INTERVAL 1 day))should work fine in this scenario. Please take a look at this StackOverflow link for more information on fetching data n days ago.Also, kindly take a look at the updated project. Below is the screenshot of the chart when its run in local-server.

___________
Indranil Deo
Team CanvasJSThanks for the suggestion. I will discuss this behavior with the team for future releases.
___________
Indranil Deo,
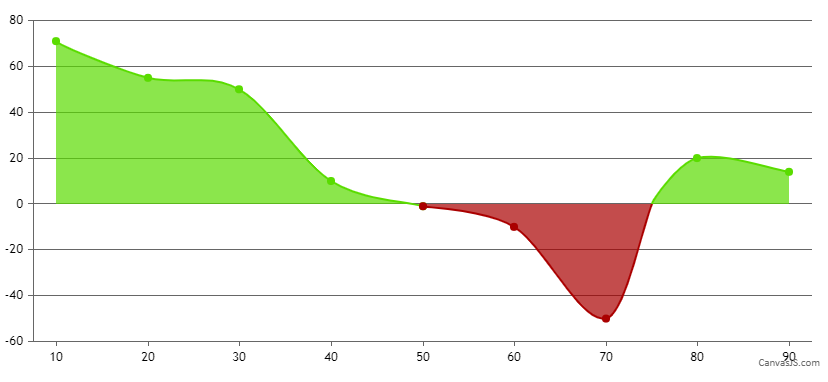
Team CanvasJSyou can have different color for each region by setting the color property
color: 'rgb(90, 220, 0)'for individual dataSeries and splitting the dataSeries based on positive or negative. Please take a look at this JSFiddle.
___________
Indranil Deo
Team CanvasJSMarch 9, 2018 at 9:40 am in reply to: Creating Dynamic Graphs on a PHP page based off MySQL data #19872I think you forgot to share the link to the sample project. The link shared is for the ReadMe file. Can you kindly share the link to the sample project, so that we can look into it and help you out!
___________
Indranil Deo,
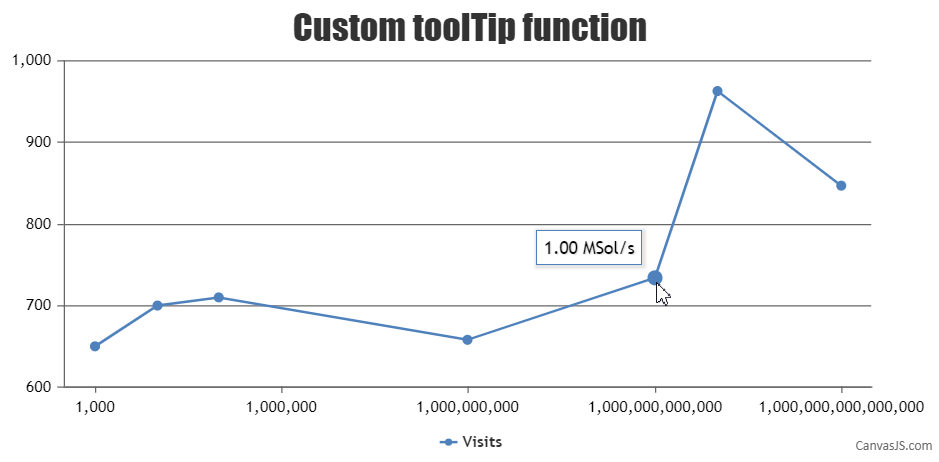
Team CanvasJSJust like formatting the axis labels can be achieved using labelFormatter as shown in this example, you can also format toolTip content using contentFormatter according to your requirements as shown in the below code snippet –
toolTip: {
  contentFormatter: contentFormatter
},
function contentFormatter(e){ var hashrate = e.entries[0].dataPoint.x; if (hashrate < 1000000) { return (Math.round(hashrate / 1000) / 1000 ).toFixed(2)+' Sol/s'; } var byteUnits = [ ' Sol/s', ' KSol/s', ' MSol/s', ' GSol/s', ' TSol/s', ' PSol/s' ]; var i = Math.floor((Math.log(hashrate/1000) / Math.log(1000)) - 1); hashrate = (hashrate/1000) / Math.pow(1000, i + 1); return hashrate.toFixed(2) + byteUnits[i]; }Please take a look at this JSFiddle for a working example.

___________
Indranil Deo
Team CanvasJSMarch 7, 2018 at 9:50 am in reply to: Creating Dynamic Graphs on a PHP page based off MySQL data #19849Please download the PHP sample from the download page which includes example for creating chart from database. In case it doesn’t help your out can you please create a sample project with a sample database and share it over Google-Drive or Onedrive so that we can understand your code better and help you out?
___________
Indranil Deo,
Team CanvasJSMarch 6, 2018 at 2:56 pm in reply to: How to make multi spline chart from specified columns of CSV #19840Aung,
Using parseFloat instead of parseInt should work fine in your case. Please take a look at this updated jsfiddle.
___________
Indranil Deo,
Team CanvasJSCan you please create a jsfiddle reproducing the issue you are facing so that we can look into your code and help you out.
__________
Indranil Deo,
Team CanvasJSMarch 6, 2018 at 10:06 am in reply to: How to make multi spline chart from specified columns of CSV #19834March 2, 2018 at 12:21 pm in reply to: How can i get access to a canvasJS chart through a DOM-Container #19812Please use
var c = $("#chartContainer").CanvasJSChart();. Also take a look at this updated jsfiddle.And please use the jQuery plugin (https://cdn.canvasjs.com/jquery.canvasjs.min.js) instead of Javascript.
___________
Indranil Deo,
Team CanvasJS