Login to Ask a Question or Reply
You must be logged in to post your query.
Home › Forums › Chart Support › How to make multi spline chart from specified columns of CSV
How to make multi spline chart from specified columns of CSV
- This topic has 9 replies, 3 voices, and was last updated 2 years, 7 months ago by
Manoj Mohan.
-
March 4, 2018 at 5:30 pm #19824
Dear All,
I Would like to create multi spline chart for my web site.
I want to make chart from .csv files which updates every 5 minutes.
I sent it to my website via FTP.
I am new to Html.Here is my csv example.
I’ve tried how to chart from csv file but I cannot really make it work.
The Point is that I would like to create Time Vs T1,T2,T3,T3,T4,..,T10 chart.
Batt & PTemp would be neglected.
In my csv T9 & T10 are zero (0).Any help would be appreciated.
Regards,
AungHtetTime,Batt,Ptemp,T1,T2,T3,T4,T5,T6,T7,T8,T9,T10
3/3/2018 14:40:00,12.38,28.16,25.61,26.02,26.24,27.37,26.4,27.74,25.91,25.96,NAN,NAN
3/3/2018 14:41:00,12.37,28.16,25.68,26.19,26.32,27.39,26.58,27.9,26.09,26.13,NAN,NAN
3/3/2018 14:42:00,12.36,28.16,25.58,26.14,26.3,27.42,26.6,27.87,25.96,26,NAN,NAN
3/3/2018 14:43:00,12.39,28.16,25.68,26.27,26.36,27.37,26.65,27.86,26.1,26.16,NAN,NAN
3/3/2018 14:44:00,12.4,28.16,25.58,26.05,26.46,27.43,26.57,27.74,25.93,25.98,NAN,NAN
3/3/2018 14:45:00,12.38,28.15,25.58,26.12,26.58,27.41,26.49,27.8,25.93,25.99,NAN,NAN
3/3/2018 14:46:00,12.4,28.15,25.6,26.07,26.64,27.47,26.49,27.87,25.88,25.91,NAN,NAN
3/3/2018 14:47:00,12.38,28.15,25.6,26.1,26.63,27.42,26.51,27.84,25.93,25.95,NAN,NAN
3/3/2018 14:48:00,12.39,28.16,25.65,26.21,26.65,27.51,26.55,27.87,26.05,26.04,NAN,NAN
3/3/2018 14:49:00,12.38,28.17,25.66,26.31,26.72,27.52,26.49,27.86,26.14,26.19,NAN,NAN
3/3/2018 14:50:00,12.39,28.17,25.88,26.51,26.79,27.55,26.57,27.88,26.33,26.38,NAN,NAN
3/3/2018 14:51:00,12.38,28.18,25.61,26.23,26.65,27.51,26.5,27.86,26.04,26.06,NAN,NAN
3/3/2018 14:52:00,12.39,28.18,25.63,26.08,26.64,27.56,26.49,27.82,25.96,25.95,NAN,NAN
3/3/2018 14:53:00,12.39,28.19,25.55,25.91,26.64,27.57,26.42,27.84,25.8,25.82,NAN,NAN
3/3/2018 14:54:00,12.39,28.19,25.81,26.32,26.8,27.62,26.57,27.81,26.22,26.24,NAN,NAN
3/3/2018 14:55:00,12.39,28.19,25.62,26.07,26.74,27.56,26.52,27.9,25.94,25.93,NAN,NAN
3/3/2018 14:56:00,12.39,28.2,25.7,26.14,26.79,27.57,26.55,27.93,25.97,26,NAN,NAN
3/3/2018 14:57:00,12.39,28.22,25.66,26.08,26.82,27.48,26.53,28,25.92,25.92,NAN,NAN
3/3/2018 14:58:00,12.37,28.24,25.62,26.21,26.79,27.59,26.62,28.05,25.95,26,NAN,NAN
3/3/2018 14:59:00,12.38,28.26,25.72,26.13,26.88,27.6,26.58,28.11,25.96,26,NAN,NAN
3/3/2018 15:00:00,12.38,28.27,25.64,26.02,26.84,27.41,26.6,28,25.9,25.9,NAN,NAN
3/3/2018 15:01:00,12.38,28.28,26.07,26.43,26.92,27.45,26.81,27.86,26.28,26.31,NAN,NAN
3/3/2018 15:02:00,12.38,28.29,25.78,26.36,26.92,27.39,26.74,28.09,26.12,26.09,NAN,NAN
3/3/2018 15:03:00,12.38,28.3,25.83,26.3,26.3,27.55,26.73,28.17,26.15,26.13,NAN,NAN-
This topic was modified 8 years, 5 months ago by
Aung Htet. Reason: updated csv values
March 6, 2018 at 10:06 am #19834March 6, 2018 at 12:55 pm #19838Dear Indranil Deo,
Many Thanks for your help,
It works like a charm.
The only thing needed is that the chart is not smooth and it is very sharp to look.
How do fix it to look like a basic line chart?
Can you help me with that as I am new to html?
Your help would be very appreciated.
Regards,
Aung HtetMarch 6, 2018 at 1:41 pm #19839Dear Indranil Deo,
After several modifications,
My chart works flawlessly,
The only thing needed is that the datas from y axis does not show as they were!
They are rounded up.
I would like to make them show as the digits they have.
Your help would be very appreciated.
With Many Thanks.
Regards,
Aung HtetMarch 6, 2018 at 2:56 pm #19840Aung,
Using parseFloat instead of parseInt should work fine in your case. Please take a look at this updated jsfiddle.
___________
Indranil Deo,
Team CanvasJSMarch 6, 2018 at 2:58 pm #19841Dear Mr Indranil Deo,
Many Thanks for you kind help.
You and Mr Sandeep solved my problem.
Regards,
Aung HtetMarch 21, 2018 at 4:28 pm #20019Dear Mr Indranil Deo,
How to make second chart based on 1st column as x axis and 2nd column as y axis?
Your help would be very appreciated.
Regards,
Aung HtetMarch 22, 2018 at 10:31 am #20025December 18, 2023 at 10:01 am #44354Dear Indranil Deo,
Long time no contact.
This time I’ve some questions.
That’s my site.
https://rtmc.csc1999.com/2019_PME_L1/pme_L1_G.html
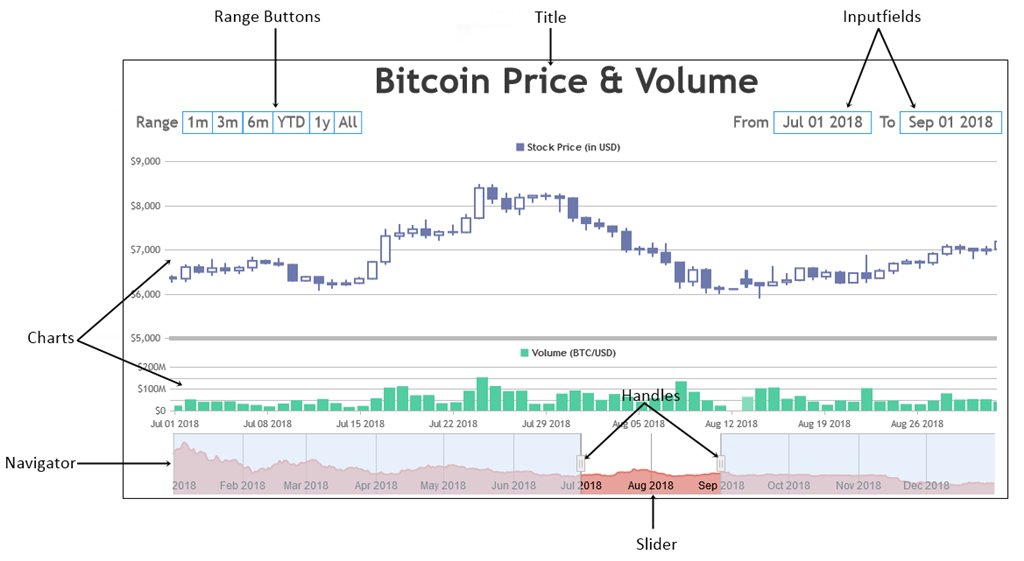
I’d like to make my chart look like stock charts with data navigator capability like in this link!
https://canvasjs.com/javascript-stockcharts/stockchart-combination-charts-navigator/
May I get an example?
Regards,
AungDecember 18, 2023 at 6:32 pm #44371Aung,
Range Selector and Navigator are part of StockChart, and not Chart. Using StockChart instead of Chart should fulfill your requirement.
—-
Manoj Mohan
Team CanvasJS -
This topic was modified 8 years, 5 months ago by
You must be logged in to reply to this topic.