Login to Ask a Question or Reply
Forum Replies Created by Indranil
-
Setting the xSnapDistance to a static value will work fine in your case. Please take a look at this jsfiddle.
___________
Indranil Deo,
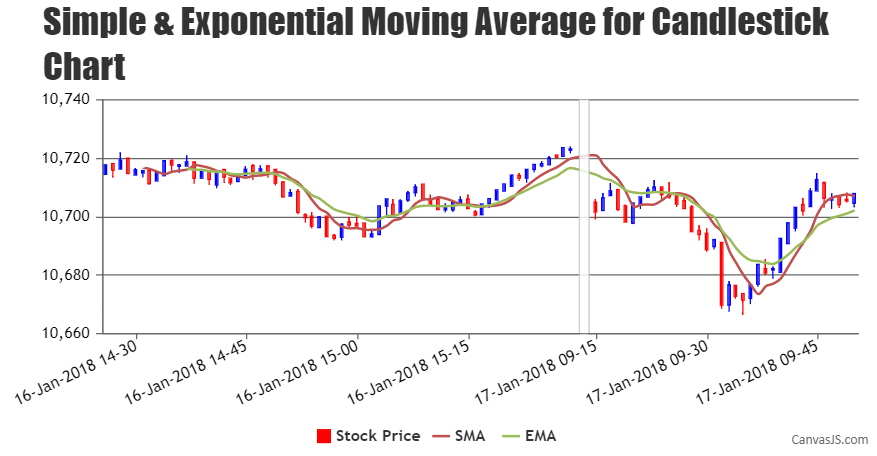
Team CanvasJSAxis labels are shown at every interval, which is auto-calculated such that the labels don’t overlap and make the chart look better. Labels are not shown for dataPoint but at every interval of axis. However, you can set the interval and intervalType to display the labels at a specific interval as shown in the code snippet below –
interval: 15,
intervalType: "minute",
Also, to shrink the region of axis on which dataPoints are not displayed you can use scaleBreaks as shown below –
scaleBreaks: {
  type: "straight",
    customBreaks: [{
      startValue: new Date(2018,00,16,15,30),
      endValue: new Date(2018,00,17,09,14)
    }]
},
Kindly take a look at this updated JSFiddle for an example.
___________
Indranil Deo
Team CanvasJSYou can use JavaScript eval() function to evaluate an expression. According to user input expression generate dataPoints and render chart. Please take a look at this jsfiddle.
___________
Indranil Deo,
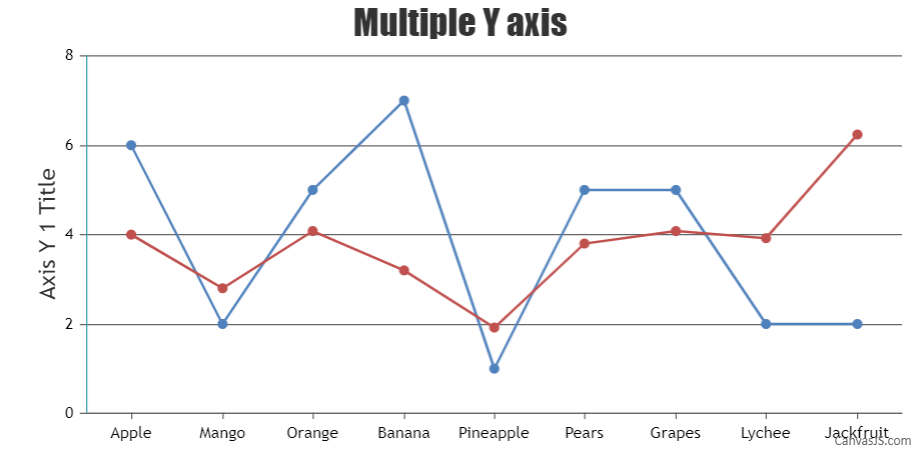
Team CanvasJSTo hide the axis line and tick you can set the lineThickness and tickThickness to 0. Please check the below code snippet to hide the axis line and tick –
{
  title: "",
  tickThickness: 0,
  lineThickness: 0,
  labelFormatter: function(){
     return " ";
  }
}
Also, kindly take a look at this JSFiddle for a working sample.
___________
Indranil Deo
Team CanvasJSPlease refer this example to create a draggable chart.
___________
Indranil Deo,
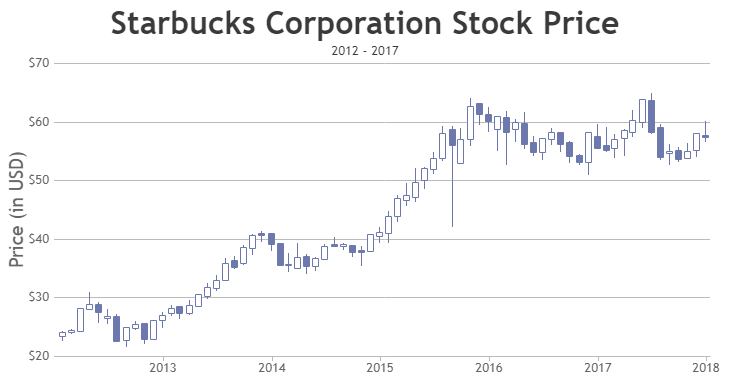
Team CanvasJSApril 6, 2018 at 10:26 am in reply to: combining candlestick chart and line chart (moving average line) #20247It seems you are using the older version of CanvasJS, the above mentioned bug was fixed in the recent version of CanvasJS (v2.0.1GA), please refer this blog post for more info. Kindly use the latest version of CanvasJS. In case the issue still persists please create a jsfiddle reproducing the issue so that we can look into it and help you out.
___________
Indranil Deo
Team CanvasJSApril 4, 2018 at 10:22 am in reply to: combining candlestick chart and line chart (moving average line) #20208Thanks for the appreciation. We will reconsider the behavior in future releases.
___________
Indranil Deo,
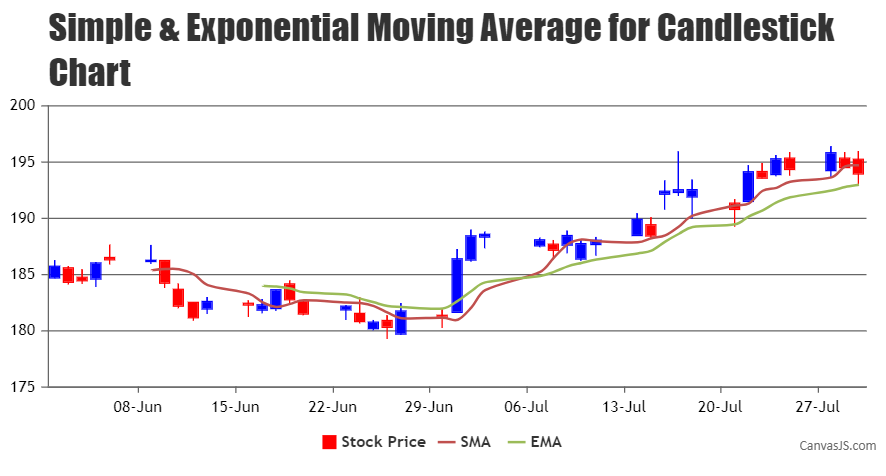
Team CanvasJSApril 4, 2018 at 9:35 am in reply to: combining candlestick chart and line chart (moving average line) #20204Assigning color to every dataPoints based on the risingColor or fallingColor will work fine in your case. Please check the below code snippet –
function changeBorderColor(chart){
    var dataSeries;
    for( var i = 0; i < chart.options.data.length; i++){
	dataSeries = chart.options.data[i];
        for(var j = 0; j < dataSeries.dataPoints.length; j++){
            dataSeries.dataPoints[j].color = (dataSeries.dataPoints[j].y[0] <= dataSeries.dataPoints[j].y[3]) ? (dataSeries.risingColor ? dataSeries.risingColor : dataSeries.color) : (dataSeries.fallingColor ? dataSeries.fallingColor : dataSeries.color);
        }
    }
}
Also kindly, take a look at this updated JSFiddle.
___________
Indranil Deo
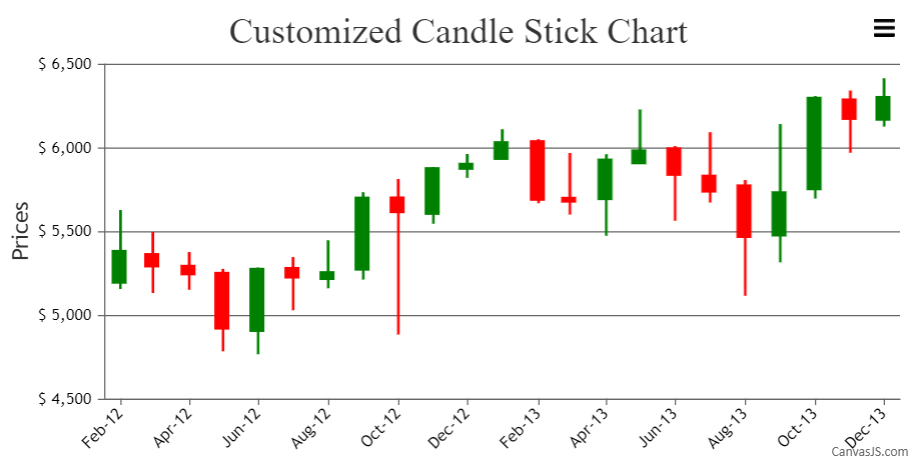
Team CanvasJSApril 3, 2018 at 9:43 am in reply to: combining candlestick chart and line chart (moving average line) #201981) Regarding fallingColor, the documentation says that “fallingColor property can only be used with waterfall chart.”.
Is there any workaround for this?In case of Candlestick Chart, fallingColor can be used to override the default color of those dataPoints whose values are less than the previous dataPoint.
2) How do I set the border color for candles? I searched the docs, but could not find it. So request you for help.
In Candlestick Chart, you can use color to set the default color of the dataPoint and the border of the dataPoint as well.
Please take a look at this JSFiddle for an example.
___________
Indranil Deo
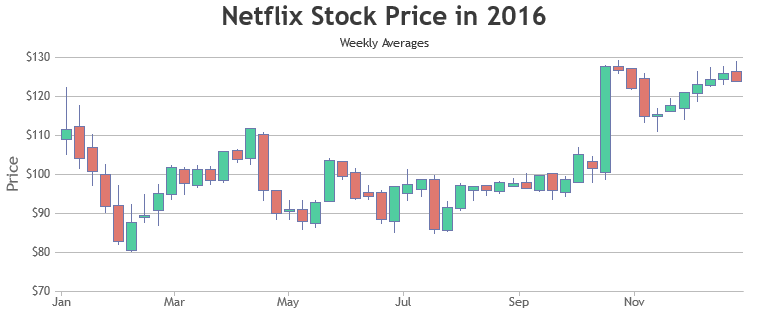
Team CanvasJSApril 2, 2018 at 9:46 am in reply to: combining candlestick chart and line chart (moving average line) #20188You can set the color, risingColor, and fallingColor to change the color in Candlestick Chart as per your requirement.
___________
Indranil Deo
Team CanvasJSMarch 29, 2018 at 9:26 pm in reply to: How to inject canvasJS dependency into my Angular app Controller? #20169We have just released v2.1 with module import/export with which you can easily integrate front-end framework like React, Angular, Vuejs, etc. Please refer to the release blog for more information. Do download the latest version from our download page and let us know your feedback.
___________
Indranil Deo,
Team CanvasJSWe have just released v2.1 with module import/export with which you can easily integrate front-end framework like React, Angular, Vuejs, etc. Please refer to the release blog for more information. Do download the latest version from our download page and let us know your feedback.
___________
Indranil Deo,
Team CanvasJS