CanvasJS Charts 1.8.1 Beta 2 Released
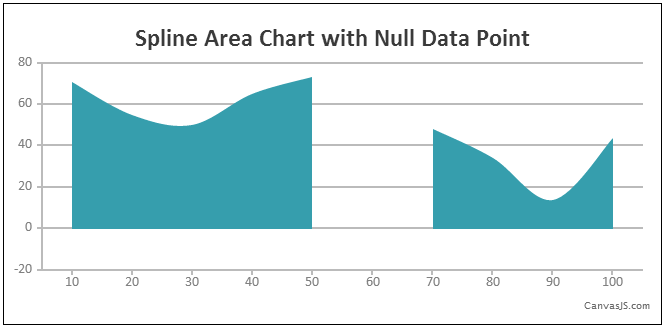
Today we are releasing 1.8.1 Beta 2 with new features and several bug fixes. Below is a summary of this release. New Features & Enhancement Null Data and connetNullData for all Area Chart Types which allows you to show discontinuity of dataPoints with dotted lines lineColor & lineDashType in Data Point and Data Series level
CanvasJS Charts 1.8.1 Beta 1 Released
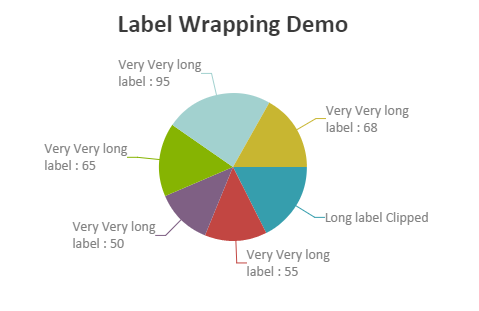
Today we are releasing 1.8.1 Beta 1 with seven new features and several bug fixes. Below is a summary of this release. New Features & Enhancement Auto-Labelling which automatically handles label placement in the best possible way titleWrap which allows you to wrap the axis-title labelPlacement which allows you to place stripline label inside or
CanvasJS 1.8.0 Beta 5 released with some major bug fixes
CanvasJS 1.8.0 Beta 5 released with some major bug fixes Here is CanvasJS 1.8.0 Beta 5 with some major bug fixes. If you are testing with beta 4, we highly recommend that you upgrade to this version. Below is a summary of this release. Bug Fixes Setting indexLabelLineThickness to 0 was not removing the index
CanvasJS Charts 1.8.0 Beta 4 Released with dataPointMinWidth and dataPointMaxWidth
Today we are releasing 1.8.0 Beta 4 with several bug fixes and two new features. Below is a summary of this release. New Features dataPointMinWidthwhich allows you to set minimum limit on dataPoint’s width in column, bar, ohlc and candlestick charts dataPointWidth which allows you to fix dataPoint’s width in column, bar, ohlc and candlestick
In v1.8 you can Sync multiple chart ranges, zoom vertically and control Pie/Doughnut Chart size
Ability to sync multiple chart ranges has been one of the popular requests since last couple of months and hence we decided to implement the same. Along with sync we have also added feature to allow vertical zooming/panning. These two features should allow you to create more advanced dashboards and also improve the user experience.
CanvasJS 1.7.0 goes GA
Today we are releasing 1.7.0 GA with a few bug fixes. Below is a summary of this release. Bug Fixes It was not able to reset axis minimum and maximum to be handled automatically by setting them to null. In Pie/ doughnut and stacked charts, if a dataPoint’s percent is 0, indexLabel was being shown
CanvasJS Charts 1.6.2 Released
Today we are releasing 1.6.2 GA with several bug fixes. Below is a summary of this release. Bug Fixes Browser used to crash if all series related to an axis were hidden while interval is set – used to work fine if the interval is not set. If max and min dataPoint y values were
CanvasJS Charts 1.6.1 Released
Today we are releasing 1.6.1 GA with several bug fixes and enhancements. Below is a summary of this release. New Properties legendMarkerBorderColor & legendMarkerBorderThickness properties in dataPoint and dataSeries. Bug Fixes Marker Border Color and thickness was not enabled in case of scatter charts. Highlighted objects were not visible properly (sometimes partially visible) if they
CanvasJS Charts 1.6.0 goes GA
Today we are releasing v1.6 GA with several bug fixes and enhancements. This is a major version which includes animation support along with several enhancements and bug fixes. Below is a summary of this release. You can read more about the features introduced in v1.6.0 in its beta release blog. Bug Fixes Trying to save


