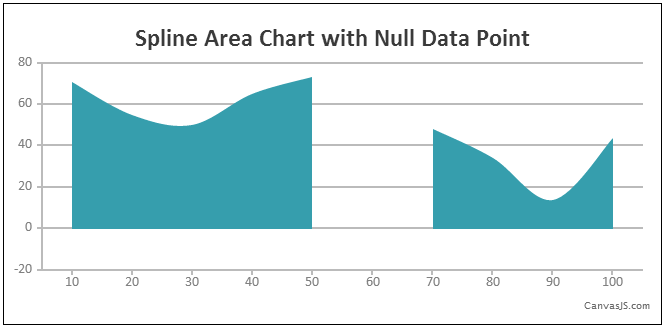
Here is version 1.4 Beta with most sought after features like StripLines (TrendLines), Event for Legend Items & support for Empty/Null Data Points in Chart. Below is a summary of this release
New Features & Improvements
- Support for StripLines / TrendLines
- Events for Legend Items – itemclick, itemmouseover, itemmouseout & itemmousemove
- Support for Empty / Null data points
New Properties
- visible property in dataSeries – by combining this with legend events you can hide/unhide a data series on click of legend item. Here is a tutorial
Please download the beta version from the download page and let us know your feedback. Please report any bugs in the forum.
I would also like to thank all of our users who gave valuable feedback & reported bugs.
—
Thank You
Team CanvasJS
7 Comments

Hi Sunil,
Where can i find the documentation for the stripLine and trendLine ?
Tim
Tim,
Here is the documentation for striplines. Sorry about the delay in updating the documentation.
—
Sunil Urs
Pingback: CanvasJS v1.4 goes GA - CanvasJS
Hello I m getting error Uncaught Reference c is not defined when i zoom in out web page.
Please help
ankitcanvas,
Can you please create a jsfiddle and post it into our forum, so that we can have a look?
var chart_1= new CanvasJS.Chart(“chartContainer_1”, {
title:{
fontSize: 20,
fontColor:’#0095da’,
fontWeight:’normal’,
text: ‘HW’
},
exportEnabled: true,
exportFileName: ‘HW’,
zoomEnabled:false,
axisY:{
interlacedColor: “#fbfbfb”,
tickLength: 1,
tickThickness: 1,
//suffix: ‘m’,
labelFontSize: 12,
labelFontColor:’#0095da’,
minimum : -4.5
},
toolTip:{
shared: true,
content: function(e){
var body = new String;
var head ;
for (var i = 0; i < e.entries.length; i++){
var str = " ” + e.entries[i].dataSeries.name + “: “+ e.entries[i].dataPoint.y + “ ” ;
body = body.concat(str);
}
head = “Date Time :“+ (parseDate(e.entries[0].dataPoint.x)) + ““;
return (head.concat(body));
}
},
axisX:{
gridColor: “Silver”,
tickColor: “silver”,
valueFormatString: “DD-MM-YYYY hh:mm TT”,
title:’Date Time’,
titleFontSize: 17,
//titleFontColor:’#0095da’,
labelAngle: 97,
labelFontSize: 12,
labelFontColor:’#0095da’
},
data: [
{
type: “line”,
lineThickness:3,
showInLegend: true,
name: ‘Height(m)’,
color: “#00B74F”,
dataPoints: [{ x : new Date(1415016180000) , y : 2.0 },{ x : new Date(1420093800000) , y : 2.0 },{ x : new Date(1420790940000) , y : 1.0 },{ x : new Date(1420877280000) , y : 2.0 },{ x : new Date(1421815440000) , y : 1.0 },{ x : new Date(1421818740000) , y : 2.0 },{ x : new Date(1421991540000) , y :”}]
},
{
type: “line”,
lineThickness:3,
showInLegend: true,
name: ‘Weight(kg)’,
color: “#0095C8″,
dataPoints: [{ x : new Date(1415016180000) , y : 120.0 },{ x : new Date(1420093800000) , y : 142.0 },{ x : new Date(1420790940000) , y : 300.0 },{ x : new Date(1420877280000) , y : 100.0 },{ x : new Date(1421815440000) , y : 120.0 },{ x : new Date(1421818740000) , y : 142.0 },{ x : new Date(1421991540000) , y :”}]
}
]
});
chart_1.render();
I get error at line 67 following line Uncaught Reference c is not defined Please Help
a._zoomButton,”zoom”):L(a,a._zoomButton,”pan”),a._resetButton.getAttribute(“state”)!==a._cultureInfo.resetText&&L(a,a._resetButton,”reset”));if(0===this.renderCount||c||d)this._creditLink.setAttribute(“href”,this.creditHref),this._creditLink.innerHTML=this.creditText;this.creditHref&&this.creditText?this._creditLink.parentElement||
Ankit,
May I know your browser and version? Also please try with our latest version to see if the issue has been fixed.