Ability to sync multiple chart ranges has been one of the popular requests since last couple of months and hence we decided to implement the same. Along with sync we have also added feature to allow vertical zooming/panning. These two features should allow you to create more advanced dashboards and also improve the user experience. Below is a summary of this release.
New Features & Properties
- Vertical Zooming by using zoomType: (“x” | “y” | “xy”)
- Zooming & Panning programmatically using viewportMinimum & viewportMaximum
- rangeChanging & rangeChanged events to notify change in range while panning/zooming (using mouse or touch). Using this event along with viewportMinimum & viewportMaximum you’ll be able to sync range of multiple charts as shown in this example.
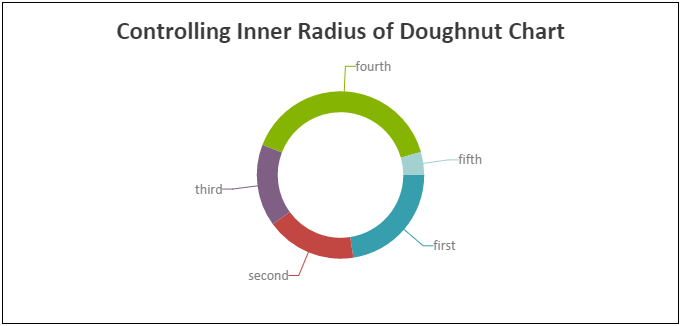
- Controlling Doughnut/Pie size using radius and innerRadius
Synching Charts
Using rangeChanging/rangeChanged events along with viewportMinimum & viewportMaximum you’ll be able to sync range of multiple charts as shown in below examples.
In coming months we’ll be improving chart axis with more power packed features. So do check out these features and let us know your feedback.
Thank You,
Sunil Urs
Team CanvasJS
11 Comments

Hey,
There is a bug, which can be tested in both “Synching Charts”-examples.
When you zoom into the first diagram, both diagrams are zoomed.
But when you click “reset” in the second diagram, only the second diagram is reset. The first one is still zoomed.
It works, if you perform both actions in the same diagram.
Would be nice, when you can take a look.
Best regards
Thomas
Thomas,
The issue has been fixed in the latest beta version – v1.8.0 Beta 4. Please try with this version and it should work fine.
Thanks for reporting the issue.
Nice! Thank you :)
Hi Sunil,
If it is doable, it would be great to also synch data point highlighting.
We have for example two scatter charts next to each other, where one chart shows the location of an object and the other one measurements.
I looked to programatically highlight a corresponding datapoint in the other chart when hovering over that one, but I failed.
Do you know if that is already possible somehow?
Regards,
Christian
Christian,
As of now it’s not possible.
Thanks for your suggestion. It’s in our road-map but we don’t have a fixed timeline yet.
Pingback: Feature Roundup - All Major Updates in CanvasJS Charts - CanvasJS
Hi! Someone in my Facebook group shared this skte with us so I came to give it a look.
I’m definitely enjoying the information. I’m book-marking and willl
be tweeting this to my followers! Superb blog and wonderful design.
This post is genuinely a nice one it assists new
the web viewers, who are wishing for blogging.
When I zoom in one of the charts, second is not zooms.
When I reset zoom in one of them, both are reset. How to fix this problem?
Would I post screenshot , but I can’t :(
I fixed the problem by adding [0] into code.
I’m talking about Syncing X Axis Range of two Charts (http://jsfiddle.net/canvasjs/s4xmsd43/)
chart.options.axisX.viewportMinimum = e.axisX[0].viewportMinimum;
chart.options.axisX.viewportMaximum = e.axisX[0].viewportMaximum;
Aparus,
Thanks for pointing this out.
As we added multiple axis support in v1.9.5 , all axis parameters in events like rangeChanging / rangeChanged have been changed to array from object. And we have missed out updating this jsfiddle, which we did now.