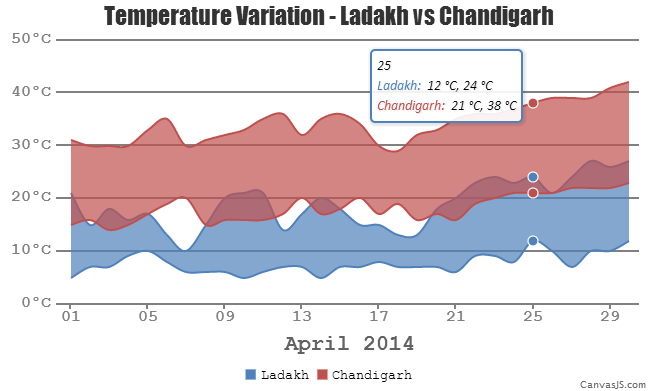
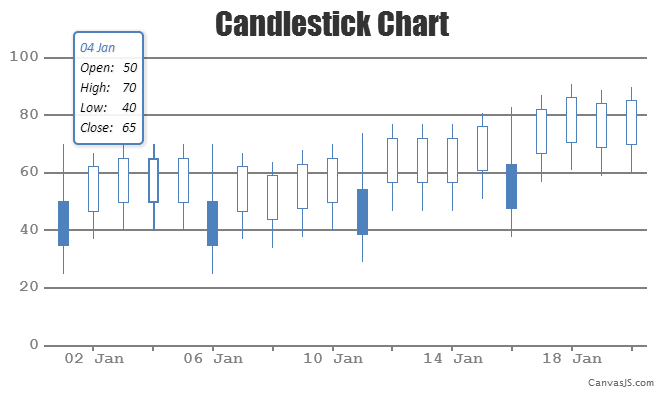
Today we are releasing v1.5 (beta) of CanvasJS with some major features that you have been waiting for. In this version we have implemented 6 new Chart Types – Candlestick, OHLC, Range Column, Range Bar, Range Area & Range Spline Area – which takes the total chart types supported to 24. We have also implemented image export features which has been one of the most requested feature.
As part of Range Charts we have Range Column, Range Bar, Range Area & Range Spline Area
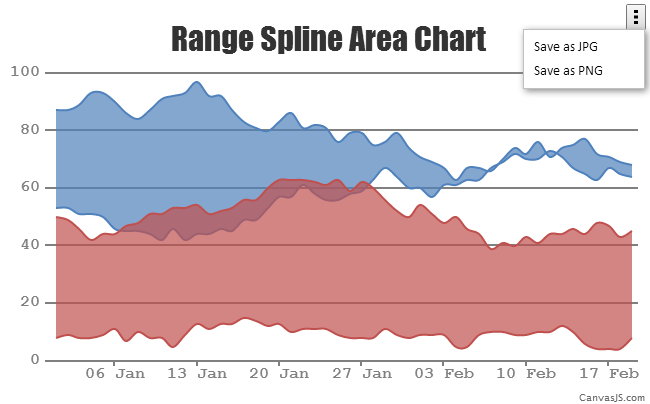
(Below screenshot is of Range Spline Area. Please check out our gallery for others.)

As part of stock charts we have added Candlestick and OHLC
(Please check out our gallery for OHLC)

Export Feature
Now CanvasJS comes with the ability to export any chart as an image. Currently we support JPG and PNG formats. You can enabled this feature by setting exportEnabled property of Chart to true.

Release Summary:
New Features & Enhancements
- New Stock / Financial Charts – candlestick and ohlc
- New Range Charts – Range Column, Range Bar, Range Area & Range Spline Area
- Export as image – JPG & PNG
- Now you can pass DOM element as constructor parameter instead of ID
- Toolbar – Reset and Zoom buttons have been replaced by image buttons
- Now Border Lines appear for all Area Charts by default. You can disable the same using lineThickness property
- fillOpacity property in dataSeries – defaults to 1 for all non-area chart types and 0.7 for area chart types
- indexLabel for scatter and bubble charts. Thus indexLabels are now available in all chart types.
- Increased the zoom limit in all chart types.
- Now you can use keywords like {y[0]}, {xyz[3]}, etc
Bug Fixes
- Axis X labels were getting clipped to the left once they go outside the axis x boundary. Now they are no longer being clipped at the boundary.
New Properties & Keywords
- exportEnabled property in chart
- fillOpacity in dataSeries
- risingColor property in dataSeries – can be used in candlestick charts
- saveJPGText, savePNGText & menuText in cultureInfo
- #index keyword which can be used in indexLabel of Range Charts
2 Comments
Hi ,
have you solved the issue of changing bar width and space between to bars in composed chart ?
Pingback: CanvasJS Charts 1.5 goes GA - CanvasJS