Login to Ask a Question or Reply
Forum Replies Created by Vishwas R
-
By giving some delay after first render of chart with animation and rendering it again along with adding shadow should work fine in this scenario. However its not possible to animate chart along with shadow. Please take a look at this updated jsfiddle.
—
Vishwas R
Team CanvasJSCan you kindly brief us the behavior you are expecting along with the use-case, so that we can understand it better and help you out?
—
Vishwas R
Team CanvasJSBianca,
We don’t have plans on supporting dashtypes in legends as of now. But we will consider it for future releases.
—
Vishwas R
Team CanvasJS@pzn,
Thanks for the suggestion. This feature is not there in our roadmap as of now but I will discuss this feature with the team & get back to you at the earliest.
—
Vishwas R
Team CanvasJSBianca,
We are not accepting custom-development at this point of time. However without legendLineDashType property also you can achieve the same as shown in this jsfiddle.
—
Vishwas R
Team CanvasJSYou can set dataPoint color based on the the dataPoint value, whether its rising or falling. Please check this jsfiddle for an example.
function changeBorderColor(chart){
  var dataSeries;
  for( var i = 0; i < chart.options.data.length; i++){
    dataSeries = chart.options.data[i];
    for(var j = 0; j < dataSeries.dataPoints.length; j++){
      dataSeries.dataPoints[j].color = (dataSeries.dataPoints[j].y[0] <= dataSeries.dataPoints[j].y[3]) ? (dataSeries.risingColor ? dataSeries.risingColor : dataSeries.color) : (dataSeries.fallingColor ? dataSeries.fallingColor : dataSeries.color);
    }
  }
}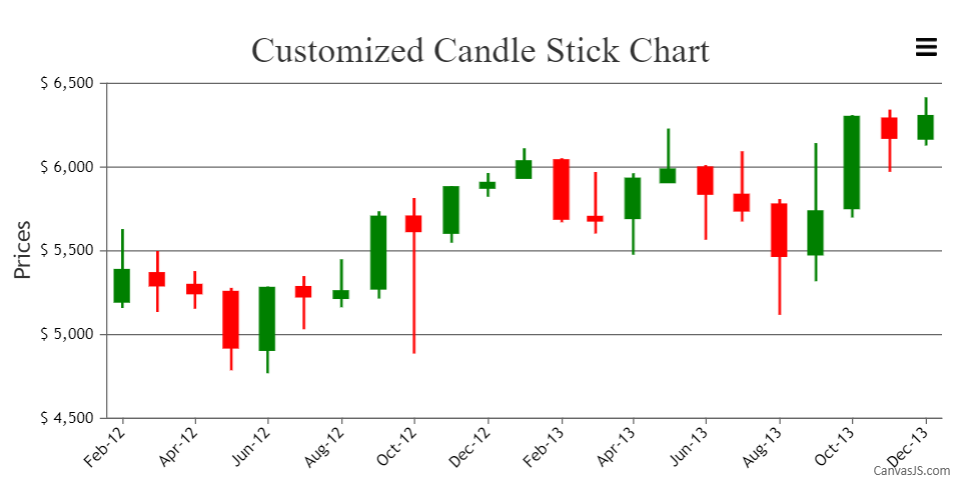
—
Vishwas R
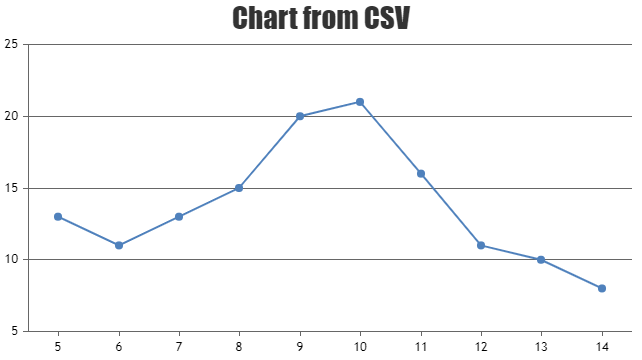
Team CanvasJSAs x-value stored in CSV is data-time, it should be parsed to date object than to float
x: parseFloat(points[0]),. Changing it tox: new Date(points[0]),should work fine in your case. Please take a look at this documentation page for step-to-step tutorial on rendering chart with data from CSV.
—
Vishwas R
Team CanvasJSRavneet,
Labels / Quarters depends on the dataPoints. If the dataPoint values starts from 4th quarter 2016, labels also start showing from Q4’16 whereas if dataPoint starts from Jan 2017, labels also starts from Q1’17. Please check this updated jsfiddle.
—-
Vishwas R
Team CanvasJSRavneet,
Rendering chart after updating chart-options should work fine in your case. Please check this updated jsfiddle for adding stripLines by updating chart-options and without using addTo method.
—
Vishwas R
Team CanvasJSRavneet,
Can you kindly create jsfiddle along with sample data, so that we can understand your scenario better and help you out?
—
Vishwas R
Team CanvasJSTobi,
Gridlines / Ticks will appear only at y-values that are integral multiples of the interval, irrespective of the minimum and maximum set.
—
Vishwas R
Team CanvasJSThere is some mismatch in the div-id being used (chart-container & chartContainer). Changing that should work fine in your case. Please take a look at this JSFiddle.
If you are still facing any issue, kindly create JSFiddle along with sample data, reproducing the issue so that we can look into it and help you out.
—
Vishwas R
Team CanvasJSYes, we were able to reproduce the issue. We will fix it in future releases.
—
Vishwas R
Team CanvasJS