Login to Ask a Question or Reply
You must be logged in to post your query.
Home › Forums › Chart Support › How can I plot my values from my local storage using JSON Objects?
How can I plot my values from my local storage using JSON Objects?
- This topic has 5 replies, 4 voices, and was last updated 9 years, 3 months ago by
Vishwas R.
Tagged: canvas, html, javascript, JSON
-
April 7, 2017 at 5:24 pm #14783
Hi guys. I am working with our school project. In the offline web application that we are working, we will be using Canvas. I am having confusions getting the JSON Object that is written inside our external JavaScript file because in the API of the CanvasJS they only imported using external JSON file.
Supposed to be, I have this kind of data in our localStorage.classStanding
[{“csName”:”Quiz #1 – Create a simple socket Program”,”csSubject”:”Integrative Programming”,”csScore”:”18″,”csPoint”:”20″},{“csName”:”Quiz #2 – Create a simple RMI application”,”csSubject”:”Integrative Programming”,”csScore”:”25″,”csPoint”:”40″}]I want to generate my chart like this but I want it to dynamically update this chart while the localStorage is updating.
function loadChart() {
var chart = new CanvasJS.Chart(“chartContainer”,{
title:{
text: “Overview of your Class Standing”
},
animationEnabled: true,
axisX:{
title: “Integrative Programming”
},
axisY:{
title: “Percent”
},
data: [{
type: “stackedColumn100”,
name: “Percentage You Passed”,
showInLegend: “true”,
dataPoints: [
{ y: 18, label: “Quiz #1 – Create a simple socket Program “},
{ y: 25, label: “Quiz #2 – Create a simple RMI application” }
]
}
, {
type: “stackedColumn100”,
name: “Percentage You Failed”,
showInLegend: “true”,
dataPoints: [
{ y: 2, label: “Quiz #1 – Create a simple socket Program “},
{ y: 15, label: “Quiz #2 – Create a simple RMI application” }
]
}]
});
chart.render();
}This function is written also in our external JavaScript. Then this function will be windows.onload in our HTML having div chartContainer.
Thank you.
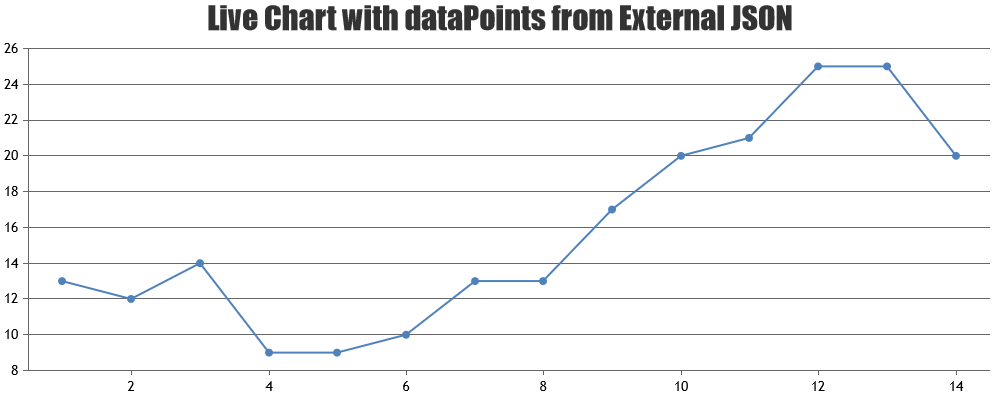
April 7, 2017 at 6:43 pm #14785Please refer this tutorial on creating Live Updating Charts from JSON API & AJAX. The data from the JSON has to be parsed in the format required by CanvasJS.
___
Suyash Singh
Team CanvasJSApril 7, 2017 at 8:41 pm #14788Thank you very much. I already resolved my problem.
April 8, 2017 at 9:47 pm #14810var jsonData = {
“December”: [
{ “x”: “1st”, “y”: 10.22 },
{ “x”: “2nd”, “y”: 11.14 },
{ “x”: “3rd”, “y”: 13.58 },
{ “x”: “4th”, “y”: 15.25 },
{ “x”: “5th”, “y”: 17.25 },
{ “x”: “6th”, “y”: 10.22 },
{ “x”: “7th”, “y”: 11.14 },
{ “x”: “8th”, “y”: 13.58 },
{ “x”: “9th”, “y”: 15.25 },
{ “x”: “10th”, “y”: 17.25 },
{ “x”: “11th”, “y”: 10.22 },
{ “x”: “12th”, “y”: 11.14 },
{ “x”: “13th”, “y”: 13.58 },
{ “x”: “14th”, “y”: 15.25 },
{ “x”: “15th”, “y”: 17.25 },
{ “x”: “16th”, “y”: 10.22 },
{ “x”: “17th”, “y”: 11.14 },
{ “x”: “18th”, “y”: 13.58 },
{ “x”: “19th”, “y”: 15.25 },
{ “x”: “20th”, “y”: 17.25 },
{ “x”: “21st”, “y”: 10.22 },
{ “x”: “22nd”, “y”: 11.14 },
{ “x”: “23rd”, “y”: 13.58 },
{ “x”: “24th”, “y”: 15.25 },
{ “x”: “25th”, “y”: 17.25 },
{ “x”: “26th”, “y”: 10.22 },
{ “x”: “27th”, “y”: 11.14 },
{ “x”: “28th”, “y”: 13.58 },
{ “x”: “29th”, “y”: 15.25 },
{ “x”: “30th”, “y”: 17.25 },
{ “x”: “31st”, “y”: 17.25 }
]}
var dataPoints = [];
var chartformonth = new CanvasJS.Chart(“profitformonth”,
{
title: {
text: “Profit For Month”
},
axisX: {
interval: 1,
intervalType: “day”
},
axisY: {
gridColor: “white”,
interval: 10,
minimum: 10,
maximum: 100
},
data: [{
type: ‘column’,
dataPoints: dataPoints
}]
});$(“.dropdown”).change(function () {
chartformonth.options.data[0].dataPoints = [];
var e = document.getElementById(“selectMonthList”);
var selected = e.options[e.selectedIndex].value;
dps = jsonData[selected];
for (var i in dps) {
chartformonth.options.data[0].dataPoints.push({ x: dps[i].x, y: dps[i].y });
}
chartformonth.render();
});
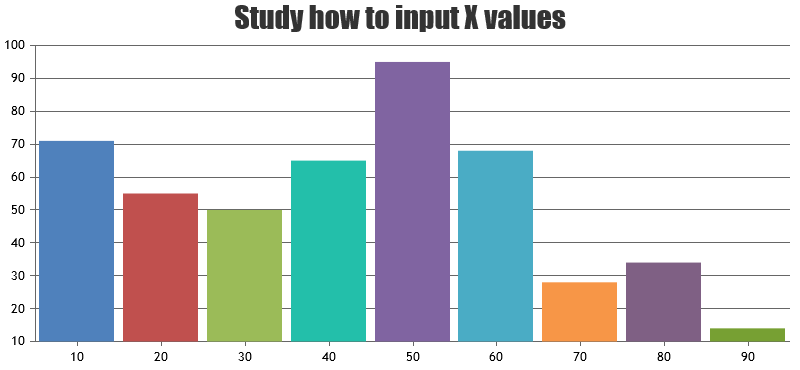
There a problem in the loop data not rendering on chart, bolded that area above area is correct. plz help!April 10, 2017 at 9:13 am #14815
Tagged: canvas, html, javascript, JSON
You must be logged in to reply to this topic.