Login to Ask a Question or Reply
Forum Replies Created by Vishwas R
-
May 13, 2021 at 6:11 pm in reply to: How to add Tooltip Functionality to X-axis labels in in canvajs #34329
Sorry, showing tooltip on hovering axis label is not available as of now.
—
Vishwas R
Team CanvasJSHTML tags are not supported in axis labels. As addressed in previous reply, if you like to break word into multiple lines you can use labelMaxWidth. If you like to add symbols in labels, you can use unicode characters. Please take a look at this thread for more information.
If this doesn’t fulfill your requirements, kindly brief us more about your requirements so that we can understand it better & try to help you achieve the same.
—
Vishwas R
Team CanvasJSRicho,
You can use JSON.parse() to convert string to JavaScript object / JSON in this case.
If you are still facing issue, kindly create JSFiddle reproducing the issue you are facing & share it with us so that we can look into the code / chart-options being used, understand the scenario better & help you out.
—
Vishwas R
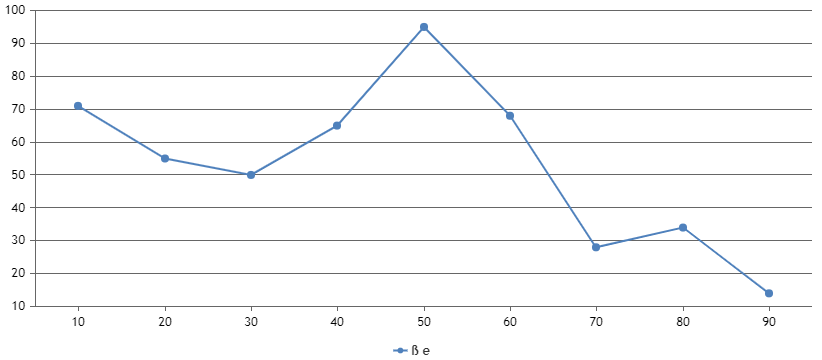
Team CanvasJSYou can show custom text in legend-items by setting legendText property (which falls back to name property of dataPoint). You can achieve this by passing legendText property along with label for each dataPoint as shown in the below code-snippet.
dataPoints.push({
	label: (points[0]),
	legendText: (points[0]),
	y: parseFloat(points[1])
});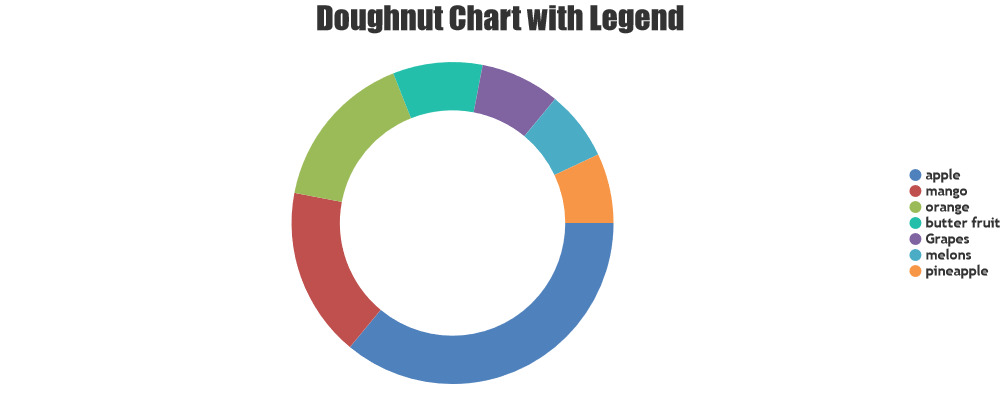
If you are still facing issue, kindly create JSFiddle reproducing the issue you are facing and share it with us so that we can look into the code / chart-options being used, understand the scenario better and help you resolve.
—
Vishwas R
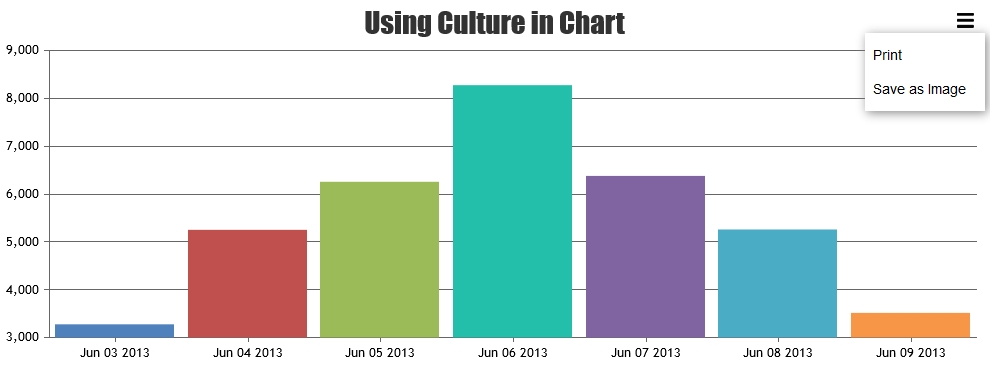
Team CanvasJSYou can customize the text of export / print options by setting culture. Either you can change the text of JPG or PNG option to ‘Save as Image’ & hide the other option with the help of CSS display property. Please find the code-snippet below.
.canvasjs-chart-toolbar div>div:nth-child(2) {
  display: none !important;
}
Please take a look at this JSFiddle for complete code.
—
Vishwas R
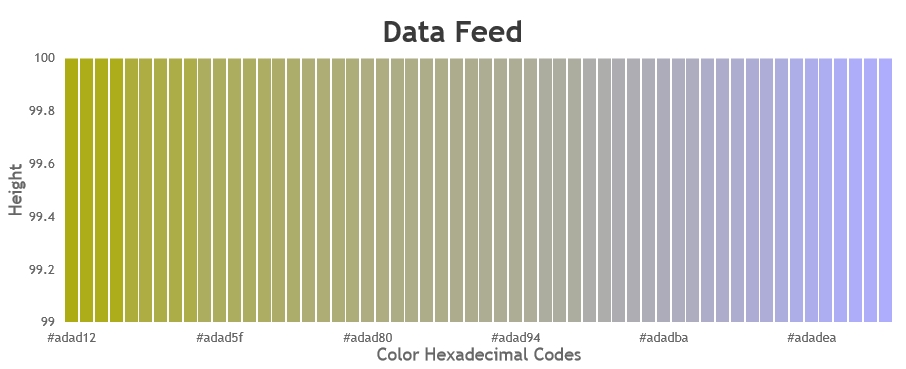
Team CanvasJSYou can swap datapoints based on colors using bubble-sort & show it in chart by adding a delay after every iteration. Delay is required as chart gets rendered within few milliseconds along with sorting datapoints. Please find the code-snippet below.
function bubbleSort() {
  var dps = chart.options.data[0].dataPoints;
  var len = dps.length;
  var inx = 0;
  var jnx = 0;

  (function sortEachElement() {
    if(jnx >= len - 1 - inx) {
      jnx = 0;
      inx++;
    }
    if(inx < len) {
      if( dps[jnx].color > dps[jnx+1].color ) {
        var temp = dps[jnx];
        dps[jnx] = dps[jnx+1];
        dps[jnx+1] = temp;
        for(var i=0; i<dps.length; i++) {
          dps[i].x = undefined;
        }
        chart.options.data[0].dataPoints = dps;
        chart.render();

      }

      jnx++;
      setTimeout(function (){
        sortEachElement();
      }, 10);
    }
  })();
}
Please take a look at this JSFiddle for complete code.
—
Vishwas R
Team CanvasJSRemoving padding towards secondary x-axis in the given example is not possible as of now. However setting negative margin to all the axes is the nearest solution that you can achieve in the above example.
If you could share JSFiddle with your use-case, we can suggest you possible solution according to the use-case.
—
Vishwas R
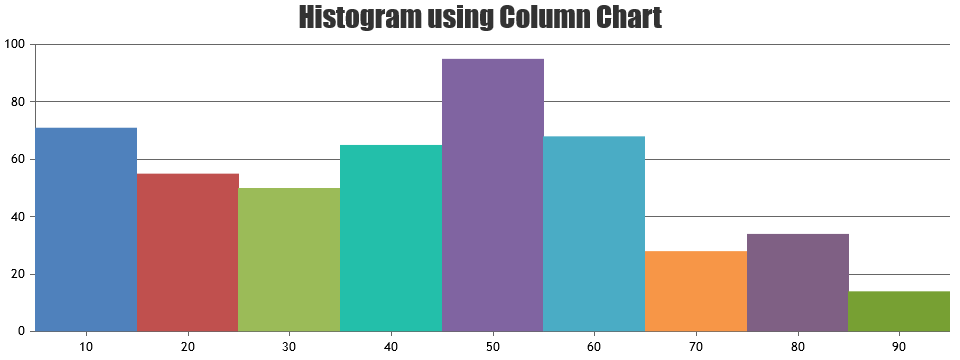
Team CanvasJSIn case of step-area chart, the step occurs at particular x-value that you pass. You can use column chart with no space between dataPoints – which you can achieve with the help of dataPointWidth property as shown in below code-snippet.
chart.set("dataPointWidth",Math.ceil(chart.axisX[0].bounds.width/chart.data[0].dataPoints.length),true);

$( window ).resize(function() {
	chart.set("dataPointWidth",Math.ceil(chart.axisX[0].bounds.width/chart.data[0].dataPoints.length),true);
});
Please take a look at this JSFiddle for working example.
—
Vishwas R
Team CanvasJSRicho,
Can you kindly share sample data that you are receiving from the service so that we can analyze it & help you in converting it to the format accepted by CanvasJS?
—
Vishwas R
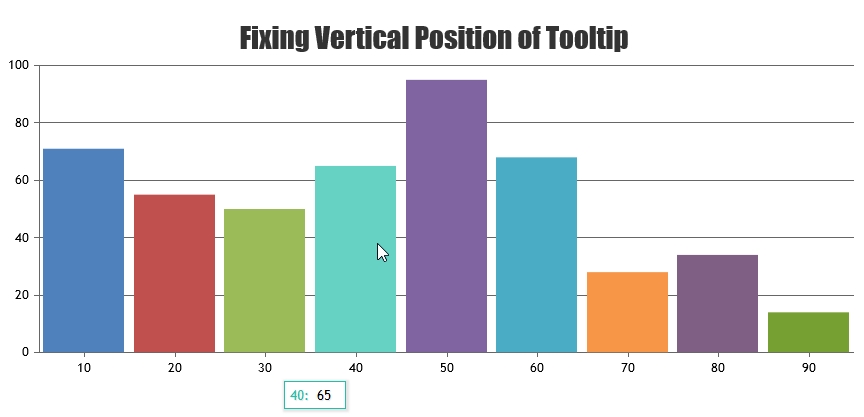
Team CanvasJSYou can fix the vertical position of tooltip by setting top & bottom CSS properties. Please find the necessary CSS styles mentioned below.
.canvasjs-chart-tooltip {
  top: 360px !important;
  bottom: auto !important;
}
Please take a look at this JSFiddle for complete code.
—
Vishwas R
Team CanvasJSRicho,
The issue might be with the format of the data being passed to the chart. Parsing it in the format accepted by CanvasJS Chart should work fine in your case. Please refer to this documentation page for step-to-step tutorial on fetching data from external source (JSON) & parsing it to the format accepted by CanvasJS before rendering chart.
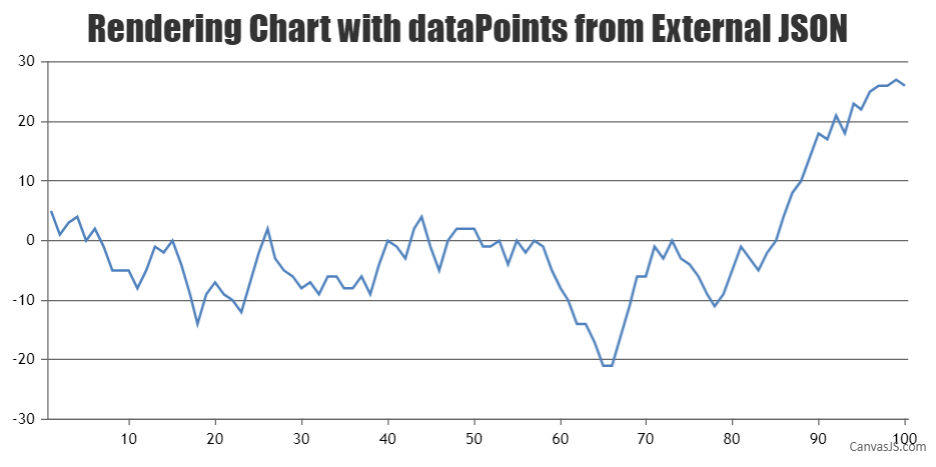
Please refer to this article for more information on adding CanvasJS charts in Arduino. Also take a look at this Github-repository for complete code.
Considering this as duplicate of Simple chart and XMLHttpRequest query. Hence closing the same.
—
Vishwas R
Team CanvasJSRicho,
The issue might be with the format of the data being passed to the chart. Parsing it in the format accepted by CanvasJS Chart should work fine in your case. Please refer to this documentation page for step-to-step tutorial on fetching data from external source (JSON) & parsing it to the format accepted by CanvasJS before rendering chart.
Please refer to this article for more information on adding CanvasJS charts in Arduino. Also take a look at this Github-repository for complete code.
—
Vishwas R
Team CanvasJSIt seems like you are not calling bubbleSort method in the code that you have shared. Calling the method seems to be working fine. Please take a look at this JSFiddle.
—
Vishwas R
Team CanvasJSSorry for the inconvenience caused. There seems to be issue with axis-range when there are less number of datapoints (1 datapoint in 2 dataseries in this case). As we were busy working on some other important features, we were unable to fix this. We will prioritize and fix it in future versions. Meantime you can get it worked by setting minimum & maximum manually. Please find the code-snippet below.
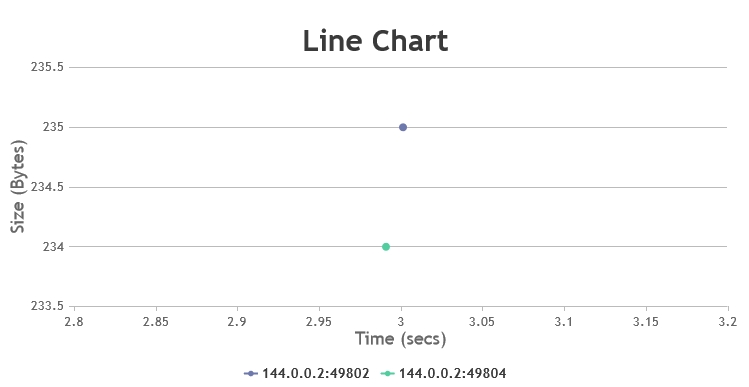
Please take a look at this JSFiddle for complete code.
—
Vishwas R
Team CanvasJSRicho,
Can you kindly create sample project reproducing the issue and share it with us over Google-Drive or Onedrive along with sample data so that we can run it locally to understand the scenario better and help you out?
—
Vishwas R
Team CanvasJS