Login to Ask a Question or Reply
You must be logged in to post your query.
Home › Forums › Chart Support › Simple chart and XMLHttpRequest query
Simple chart and XMLHttpRequest query
- This topic has 7 replies, 2 voices, and was last updated 5 years, 1 month ago by
Vishwas R.
-
April 20, 2021 at 4:25 pm #34026
Hello
I am struggling to get a simple graph to update from info sent m=by the server. Canyou please review and let me know what I need to do to fix the problem?
https://jsfiddle.net/richo/1vzo3g24/7/#&togetherjs=fytPROKrSzCheers
RichoApril 21, 2021 at 6:38 pm #34052Richo,
Can you kindly create sample project reproducing the issue and share it with us over Google-Drive or Onedrive along with sample data so that we can run it locally to understand the scenario better and help you out?
—
Vishwas R
Team CanvasJSApril 22, 2021 at 9:23 am #34059Thanks Vishwas
Project location lives here https://1drv.ms/u/s!AlhSUfM145axgakPSEyMbq4wtiSGoA?e=GnsSYiThe html.text file when modified is pasted into
http://davidjwatts.com/youtube/esp8266/esp-convertHTM.html#
which then makes the html arduino compatible, this is then placed into the arduino code lines 87-99.The major issue is getting the dataAmps variable to plot on the graph. (See html.text line 109)
April 22, 2021 at 6:40 pm #34070Richo,
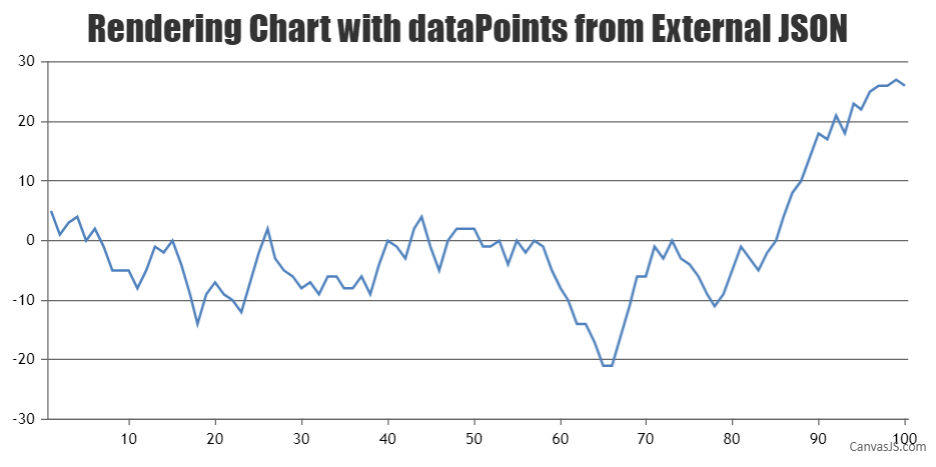
The issue might be with the format of the data being passed to the chart. Parsing it in the format accepted by CanvasJS Chart should work fine in your case. Please refer to this documentation page for step-to-step tutorial on fetching data from external source (JSON) & parsing it to the format accepted by CanvasJS before rendering chart.
Please refer to this article for more information on adding CanvasJS charts in Arduino. Also take a look at this Github-repository for complete code.
—
Vishwas R
Team CanvasJSApril 24, 2021 at 11:33 am #34095Thanks for that. Looks like you can’t give the chart an array directly, you must use a for loop to push it to the graph. I still cannot find a specific example that helps me. I almost got the graph to display data and no errors are generated, however my variables are null/empty.
I guess I need to know how to use getJSON for a local server, all the examples are using web based data whereas my data is presented by XMLHttpRequest.
April 26, 2021 at 6:54 pm #34121Richo,
Can you kindly share sample data that you are receiving from the service so that we can analyze it & help you in converting it to the format accepted by CanvasJS?
—
Vishwas R
Team CanvasJSMay 9, 2021 at 8:42 am #34267OK so I can get the chart to plot if I use static data like this:
var dataPoints = [{y : 10}, {y : 13}, {y : 18}, {y : 20}, {y : 17}];The live data that I want to plot looks like this (note this is taken directly from console.log user message:
{x: 12, y: 3.65}, {x: 16, y: 2.55}, {x: 17, y: 3.70}, {x: 17, y: 2.50}However in debug mode, Chrome is putting quotation marks around it:
eg “{x: 32, y: 1.90}”So my next question is, what is wrong with the following code that it has a problem with?
https://jsfiddle.net/richo/ktwuxp7h/1/#&togetherjs=JNEpPvLUPbThe actual error I get in the lower error console is:
Uncaught TypeError: Cannot use ‘in’ operator to search for ‘name’ in {x: 53, y: 2.05}, {x: 53, y: 2.35}, {x: 54, y: 3.75}
at H.V.setOptions (canvasjs.min.js:100)
at H.V (canvasjs.min.js:32)
at new H (canvasjs.min.js:138)
at m._initialize (canvasjs.min.js:171)
at m.render (canvasjs.min.js:202)
at UpdateGraph ((index):1)May 10, 2021 at 6:45 pm #34281Richo,
You can use JSON.parse() to convert string to JavaScript object / JSON in this case.
If you are still facing issue, kindly create JSFiddle reproducing the issue you are facing & share it with us so that we can look into the code / chart-options being used, understand the scenario better & help you out.
—
Vishwas R
Team CanvasJS
You must be logged in to reply to this topic.