Login to Ask a Question or Reply
You must be logged in to post your query.
Home › Forums › Chart Support › Chart hangs with this code
Chart hangs with this code
- This topic has 4 replies, 2 voices, and was last updated 5 years, 3 months ago by
Vishwas R.
Tagged: line chart
-
November 6, 2018 at 10:28 pm #23348
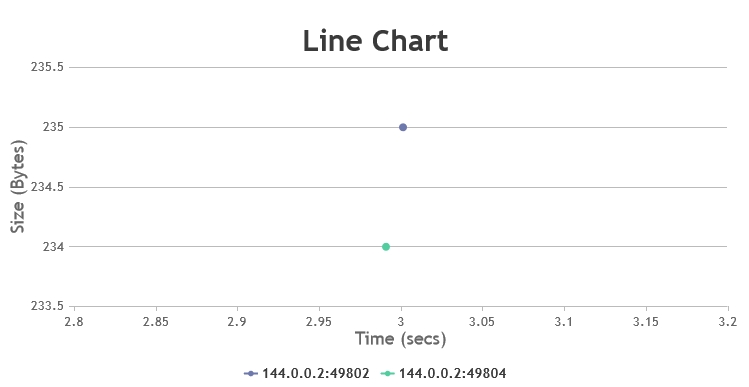
With the code below, the browser tab hangs, circling indefinitely.
The issue appears to be the rendering of two data-points that are very close apartseries1:
dataPoints: [
{ x: 3.001084, y: 235 },
]series2:
dataPoints: [
{ x: 2.991214, y: 234 },
]If I move the data points x of the series by 1 (increase or decrease), it works fine.. Looks like a bug?
<!DOCTYPE HTML>
<html>
<head>
<script>
window.onload = function () {

var chart = new CanvasJS.Chart("chartContainer", {
    animationEnabled: true,
    zoomEnabled: true,
    theme: "light2",
    title:{
        text: 'Line chart that hangs',

    },
    legend: {
        cursor: "pointer",
        itemclick: function (e) {
            if (typeof (e.dataSeries.visible) === "undefined" || e.dataSeries.visible) {
                e.dataSeries.visible = false;
            } else {
                e.dataSeries.visible = true;
            }
            e.chart.render();
        }
    },
    axisX: {
        title: 'Time (secs)',

    },
    axisY:{
        title: 'Size (Bytes)',
        includeZero: false
    },

        data: [
        {
                    type: "line",
                    name: "144.0.0.2:49802",
                    showInLegend: true,
                    dataPoints: [
                        { x: 3.001084, y: 235 },
                    ]
        },
        {
                    type: "line",
                    name: "144.0.0.2:49804",
                    showInLegend: true,
                    dataPoints: [
                        { x: 2.991214, y: 234 },
                    ]
        },
        ]

});
chart.render();
}
</script>
</head>
<body>
<div id="chartContainer" style="height: 370px; width: 100%;"></div>
<script src="https://cdn.canvasjs.com/canvasjs.min.js"></script>
</body>
</html>
November 6, 2018 at 10:34 pm #23349try changing the 2.991214 to 2.591214 and the chart would load without an issue.
November 8, 2018 at 11:28 am #23361Thanks for reporting the use-case. We are looking into the issue and will get back to you at the earliest.
—
Vishwas R
Team CanvasJSApril 20, 2021 at 8:36 pm #34037I am facing similar issue. Any update on the fix? In my case the multiple series are sharing same data. And I cannot control data and prefer not to manipulate it.
-
This reply was modified 5 years, 3 months ago by
ravidasari.
April 21, 2021 at 6:38 pm #34053Sorry for the inconvenience caused. There seems to be issue with axis-range when there are less number of datapoints (1 datapoint in 2 dataseries in this case). As we were busy working on some other important features, we were unable to fix this. We will prioritize and fix it in future versions. Meantime you can get it worked by setting minimum & maximum manually. Please find the code-snippet below.
Please take a look at this JSFiddle for complete code.
—
Vishwas R
Team CanvasJS -
This reply was modified 5 years, 3 months ago by
Tagged: line chart
You must be logged in to reply to this topic.