Login to Ask a Question or Reply
You must be logged in to post your query.
Home › Forums › StockChart Support › _assets_canvasjs_min__WEBPACK_IMPORTED_MODULE_1__.StockChart is not a constructo
_assets_canvasjs_min__WEBPACK_IMPORTED_MODULE_1__.StockChart is not a constructo
- This topic has 1 reply, 2 voices, and was last updated 5 years, 3 months ago by
Vishwas R.
Tagged: angular, Stock Chart
-
April 7, 2021 at 5:13 pm #33888
I’m using the Canvasjs in Angular but I’m getting this error _assets_canvasjs_min__WEBPACK_IMPORTED_MODULE_1__.StockChart is not a constructor.
app.component.ts
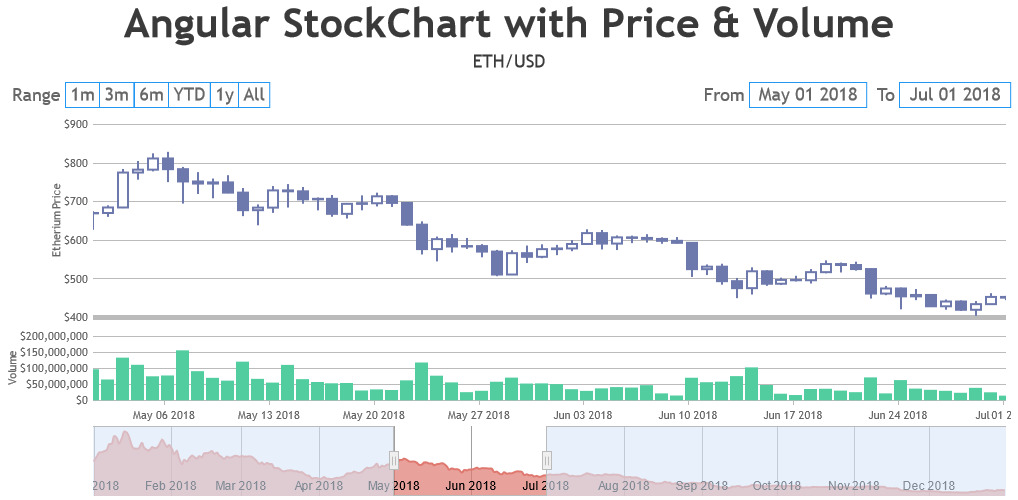
import { Component, OnInit } from '@angular/core';
import * as $ from 'jquery';
import * as CanvasJS from '../../../../assets/canvasjs.min';

@Component({
  selector: 'app-stockdetails',
  templateUrl: './stockdetails.component.html',
  styleUrls: ['./stockdetails.component.scss']
})
export class StockdetailsComponent implements OnInit {
  addSymbols(e){
    var suffixes = ["", "K", "M", "B"];
    var order = Math.max(Math.floor(Math.log(Math.abs(e.value)) / Math.log(1000)), 0);
    if(order > suffixes.length - 1)
      order = suffixes.length - 1;
    var suffix = suffixes[order];
    return CanvasJS.formatNumber(e.value / Math.pow(1000, order)) + suffix;
  }
  ngOnInit() {
    let dataPoints1 = [], dataPoints2 = [], dataPoints3 = [];
    let dpsLength = 0;
    let chart = new CanvasJS.StockChart("chartContainer",{
      theme: "light2",
      exportEnabled: true,
      title:{
        text:"Angular StockChart with Price & Volume"
      },
      subtitles: [{
        text: "ETH/USD"
      }],
      charts: [{
        toolTip: {
          shared: true
        },
        axisX: {
          lineThickness: 5,
          tickLength: 0,
          labelFormatter: function(e) {
            return "";
          },
          crosshair: {
            enabled: true,
            snapToDataPoint: true,
            labelFormatter: function(e) {
              return "";
            }
          }
        },
        axisY: {
          prefix: "$",
          tickLength: 0,
          title: "Etherium Price",
        },
        legend: {
          verticalAlign: "top"
        },
        data: [{
          name: "Price",
          yValueFormatString: "$#,###.##",
          xValueFormatString: "MMM DD YYYY",
          type: "candlestick",
          dataPoints : dataPoints1
        }]
      },{
        height: 100,
        toolTip: {
          shared: true
        },
        axisX: {
          crosshair: {
            enabled: true,
            snapToDataPoint: true,
            valueFormatString: "MMM DD YYYY"
          }
        },
        axisY: {
          prefix: "$",
          tickLength: 0,
          title: "Volume",
          labelFormatter: this.addSymbols
        },
        legend: {
          verticalAlign: "top"
        },
        data: [{
          name: "Volume",
          yValueFormatString: "$#,###.##",
          xValueFormatString: "MMM DD YYYY",
          dataPoints : dataPoints2
        }]
      }],
      navigator: {
        data: [{
          dataPoints: dataPoints3
        }],
        slider: {
          minimum: new Date("2018-05-01"),
          maximum: new Date("2018-07-01")
        }
      }
    });
    $.getJSON("https://canvasjs.com/data/docs/ethusd2018.json", function(data) {
      for(var i = 0; i < data.length; i++){
        dataPoints1.push({x: new Date(data[i].date), y: [Number(data[i].open), Number(data[i].high), Number(data[i].low), Number(data[i].close)]});;
        dataPoints2.push({x: new Date(data[i].date), y: Number(data[i].volume_usd)});
        dataPoints3.push({x: new Date(data[i].date), y: Number(data[i].close)});
      }
      chart.render();
    });
  }
}
app.component.html
<div id="chartContainer" style="height: 500px; width: 100%; margin-left: auto; margin-right: auto" ></div>-
This topic was modified 5 years, 3 months ago by
azadcoder.
April 8, 2021 at 6:17 pm #33899You can create Chart & StockChart by importing canvasjs.stock.min.js but you can create only chart using canvasjs.min.js. Based on the code that you have shared, you are trying to create StockChart using canvasjs.min.js. Instead, importing canvasjs.stock.min.js to your project should work fine in this case. Please download the StockChart from download page.
If you are still facing issue, kindly create sample project and share it with us over Google-Drive or Onedrive so that we can run it locally at our end to understand the scenario better and help you out.
—
Vishwas R
Team CanvasJS -
This topic was modified 5 years, 3 months ago by
Tagged: angular, Stock Chart
You must be logged in to reply to this topic.