Login to Ask a Question or Reply
Forum Replies Created by Thangaraj Raman
-
CanvasJS charts seems to be working fine with salesforce lightning web component. Please take a look at this Github Repo for the working code.
If you are still facing issues, kindly create a sample project reproducing the issue and share it with us over Google Drive or OneDrive so that we can look into the code, run it locally to understand the scenario better, and help you out.
—
Thangaraj Raman
Team CanvasJSJason,
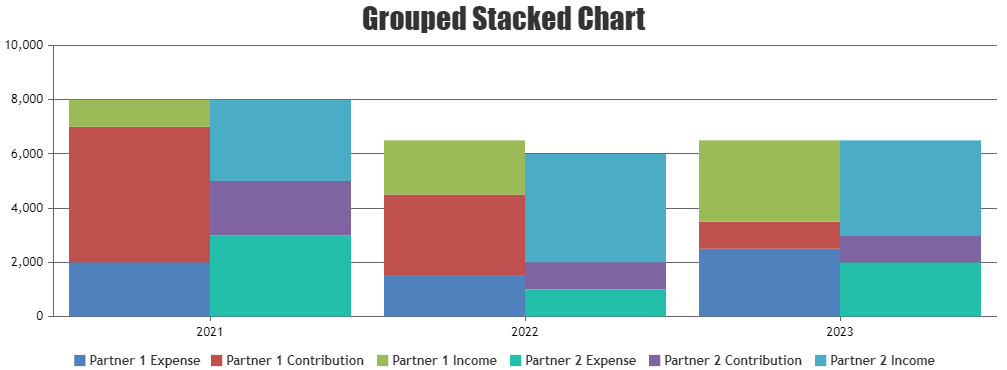
It is not possible to render a grouped-stacked chart over a single axis as of now. However, you can render each stack over a different axis to achieve the same.
Please check this JSFiddle for a working example.
—
Thangaraj Raman
Team CanvasJSJason,
Can you kindly brief us further on your requirement with a pictorial representation or an example so that we can understand your requirement better and suggest an appropriate solution?
—
Thangaraj Raman
Team CanvasJSYou can use labels instead of x-value to show the axis-x labels as per your requirement.
If you are still facing issues, kindly create a JSFiddle with sample data and share it with us so that we can look into the code, understand the scenario better, and help you out.
—
Thangaraj Raman
Team CanvasJSYou can use toolTipContent to display custom content in the tooltip or if you are looking to show some text over all the bars at once, you can use indexLabel.
If this does not meet your requirement, kindly brief us further with a pictorial representation or an example so that we can understand your requirement better and suggest an appropriate solution.
—
Thangaraj Raman
Team CanvasJSPlease check this documentation page for a step-by-step tutorial on integrating CanvasJS with your Vue application.
If you are still facing issues, kindly create a sample project reproducing the issue and share it with us over Google Drive or OneDrive so that we can look into the code, run it locally to understand the scenario better, and help you out.
—
Thangaraj Raman
Team CanvaSJSRagu,
The non-commercial version of CanvasJS is available over NPM as of now. You can download the commercial version package from My Account page and the steps to integrate have been addressed in the instruction.html file.
—
Thangaraj Raman
Team CanvasJSAugust 4, 2023 at 7:40 pm in reply to: Multiple chat with data coming from CSV not showing on same html page #43482Can you kindly create a JSFiddle, reproducing the issue you are facing & share it with us so that we can look into the code / chart-options being used, understand the scenario better and help you out?
—
Thangaraj Raman
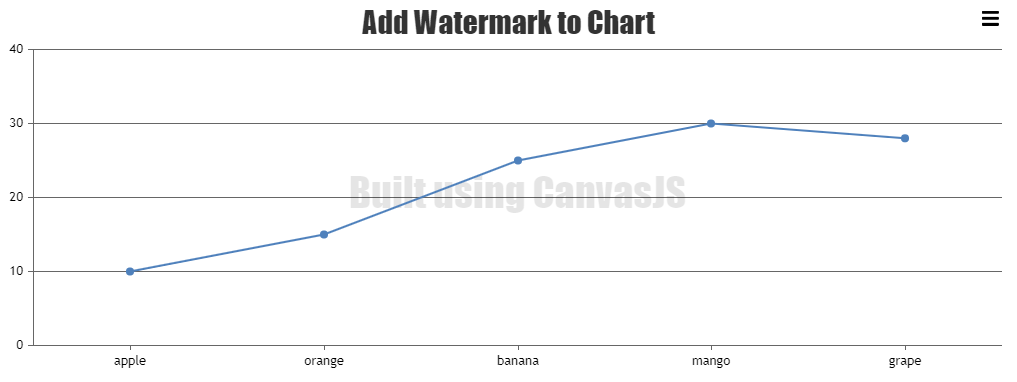
Team CanvasJSYou can use subtitles to show a watermark in the plot area of the chart as shown in the code snippet below:
subtitles: [{
    text: "Built using CanvasJS",
    fontSize: 40,
    verticalAlign: "center",
    dockInsidePlotArea: true,
    fontColor: "rgba(0,0,0,0.1)"
}],
Please check this JSFiddle for a working example.
—
Thangaraj Raman
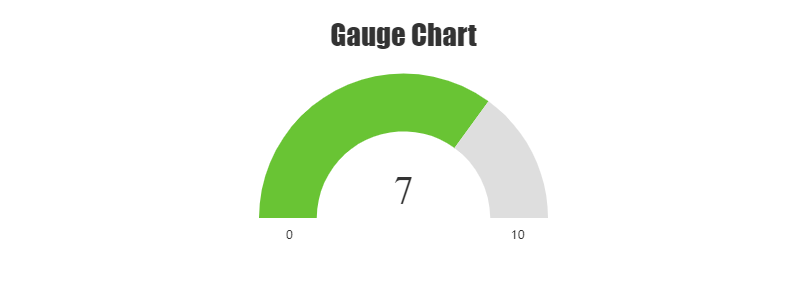
Team CanvasJSYou can add 2 dummy datapoints in the hidden region of the doughnut chart and use their indexlabels to show the minimum and maximum value of the gauge as shown in the code snippet below:
var data = {
    type: "doughnut",
    indexLabelPlacement: "inside",
    innerRadius: "60%",
    dataPoints: [
      {
        y: 1,
        indexLabel: gauge.maximum + "",
        color: "transparent"
      },
      {
        y: gauge.maximum - 2,
        color: "transparent",
        toolTipContent: null
      },
      {
        y: 1,
        indexLabel: "0",
        color: "transparent"
      },
      gauge.data,
      gauge.unoccupied,
   ],
};
Please check this JSFiddle for a working example.
—
Thangaraj Raman
Team CanvasJSA doughnut chart does not have axes. If you want to highlight the minimum and maximum values from the datapoint array, you can use subtitles to achieve the same.
If this doesn’t meet your requirement, kindly share a pictorial representation and brief us further about your requirement so that we can understand your scenario better and help you out with an appropriate solution.
—
Thangaraj Raman
Team CanvasJSWe have tested the sample locally and it seems to be working fine on our end. It looks like you might have copied just the template(index.html) & missed out on replacing the view(views.py).
Please take a look at this sample project for a working example. Replacing the trial version of the CanvasJS file (canvasjs.min.js) with the commercial version also seems to be working fine.
If you are still facing issues, kindly help us with more information like errors in the console, the browser in which the problem occurs or steps to reproduce the issue, etc.
—
Thangaraj Raman
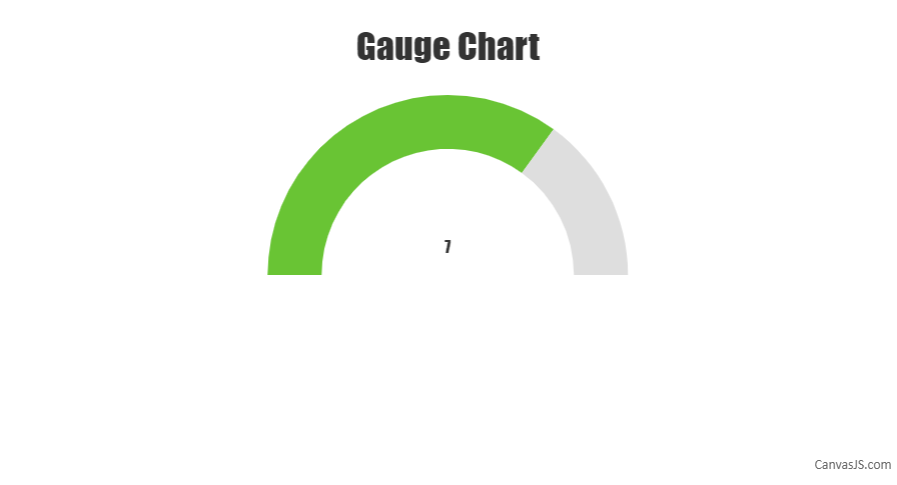
Team CanvasJSWe don’t have a gauge chart as of now but a semi-doughnut chart can be used to achieve the same. Please follow the steps below for creating a gauge chart using a doughnut chart.
First, we need to create an object that will store all the necessary data that is needed to be shown on the gauge chart. The code snippet below shows an example of that object:
var gauge = {
  title:{text: "Gauge Chart"},
  data: { y: 7 }, //gauge value
  maximum: 10
};
In the second step, we will initialize the chart object and populate its dataPoints considering the fact that only half of the doughnut chart is displayed. Please refer to the code snippet below for achieving the same:
var chart = new CanvasJS.Chart("chartContainer");
createGauge(chart);

//Function for gauge
function createGauge(chart){
  //Caluculation of remaining parameters to render gauge with the help of doughnut
  gauge.unoccupied = {
    y: gauge.maximum - gauge.data.y,
    color: "#DEDEDE",
    toolTipContent: null,
    highlightEnabled: false,
    click : function (){ gauge.unoccupied.exploded = true; }
  }
  gauge.data.click = function (){ gauge.data.exploded = true; };
  if(!gauge.data.color)
    gauge.data.color = "#69C434";
  gauge.valueText = {text: gauge.data.y.toString(), verticalAlign :"center"};

  var data = {
    type: "doughnut",
    dataPoints: [
      {
        y: gauge.maximum,
        color: "transparent",
        toolTipContent: null
      },
      gauge.data,
      gauge.unoccupied
    ],
  };

  if(!chart.options.data)
    chart.options.data = [];
  chart.options.data.push(data);

  if(gauge.title){
    chart.options.title = gauge.title;
  }

  //For showing value
  if(!chart.options.subtitles)
    chart.options.subtitles = [];
  chart.options.subtitles.push(gauge.valueText);

  chart.render();
}
Please take a look at this JSFiddle for a working example with sample code.
—
Thangaraj Raman
Team CanvasJSJuly 13, 2023 at 6:27 pm in reply to: Dynamically render a chart by selecting a region of another chart #43332You can achieve your requirement by zooming into a particular region of the chart. To enable zooming in the chart, you will have to set zoomEnabled to
true.—
Thangaraj Raman
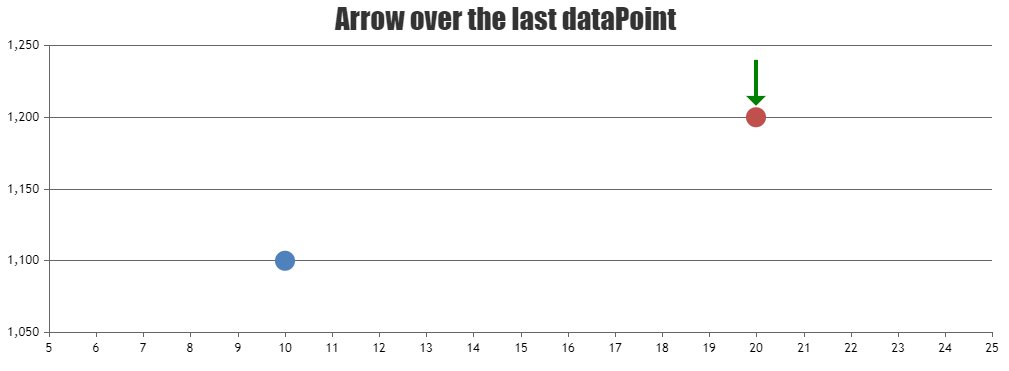
Team CanvasJSYou can show an arrow over the last datapoint, by drawing out an arrow over the chart canvas with id
.canvasjs-chart-canvas.Please check this JSFiddle for a working example.
—
Thangaraj Raman
Team CanvasJS