@chrisstone,
We don’t have a gauge chart as of now but a semi-doughnut chart can be used to achieve the same. Please follow the steps below for creating a gauge chart using a doughnut chart.
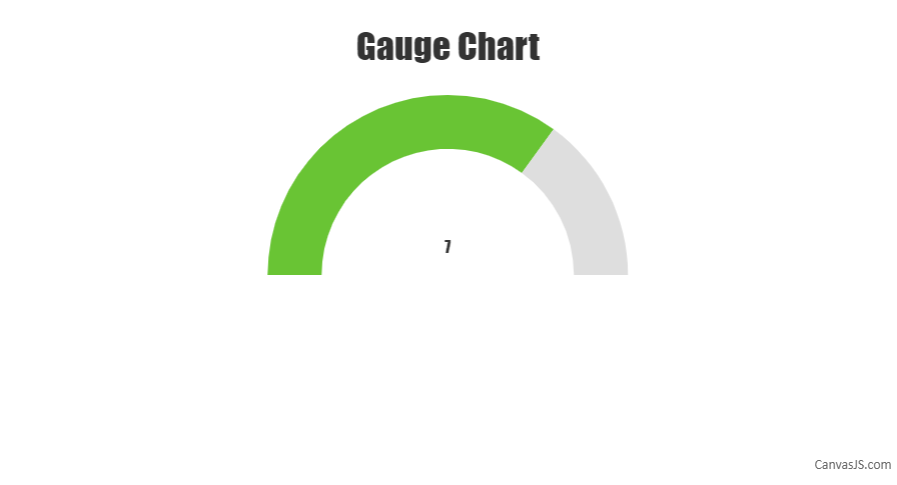
First, we need to create an object that will store all the necessary data that is needed to be shown on the gauge chart. The code snippet below shows an example of that object:
var gauge = {
  title:{text: "Gauge Chart"},
  data: { y: 7 }, //gauge value
  maximum: 10
};
In the second step, we will initialize the chart object and populate its dataPoints considering the fact that only half of the doughnut chart is displayed. Please refer to the code snippet below for achieving the same:
var chart = new CanvasJS.Chart("chartContainer");
createGauge(chart);

//Function for gauge
function createGauge(chart){
  //Caluculation of remaining parameters to render gauge with the help of doughnut
  gauge.unoccupied = {
    y: gauge.maximum - gauge.data.y,
    color: "#DEDEDE",
    toolTipContent: null,
    highlightEnabled: false,
    click : function (){ gauge.unoccupied.exploded = true; }
  }
  gauge.data.click = function (){ gauge.data.exploded = true; };
  if(!gauge.data.color)
    gauge.data.color = "#69C434";
  gauge.valueText = {text: gauge.data.y.toString(), verticalAlign :"center"};

  var data = {
    type: "doughnut",
    dataPoints: [
      {
        y: gauge.maximum,
        color: "transparent",
        toolTipContent: null
      },
      gauge.data,
      gauge.unoccupied
    ],
  };

  if(!chart.options.data)
    chart.options.data = [];
  chart.options.data.push(data);

  if(gauge.title){
    chart.options.title = gauge.title;
  }

  //For showing value
  if(!chart.options.subtitles)
    chart.options.subtitles = [];
  chart.options.subtitles.push(gauge.valueText);

  chart.render();
}
Please take a look at this JSFiddle for a working example with sample code.
—
Thangaraj Raman
Team CanvasJS
.