You must be logged in to post your query.
Home › Forums › Chart Support › Show min and max value in half doughnut chart
Tagged: Doughnut chart
Hello Could you help me how can I Set Show min and max value in half doughnut chart? I use minimum and maximum in axixX or axixY,but it doesn’t work.
@bkshn,
A doughnut chart does not have axes. If you want to highlight the minimum and maximum values from the datapoint array, you can use subtitles to achieve the same.
If this doesn’t meet your requirement, kindly share a pictorial representation and brief us further about your requirement so that we can understand your scenario better and help you out with an appropriate solution.
— Thangaraj Raman Team CanvasJS
thanks for your answer
it’s my code could you help me where I should add subtitles?
when I share my link . i can not post reply.
https://jsfiddle.net/4p9Ldvf6/103/
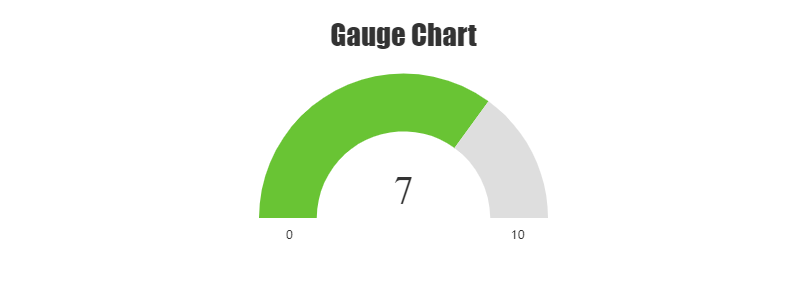
You can add 2 dummy datapoints in the hidden region of the doughnut chart and use their indexlabels to show the minimum and maximum value of the gauge as shown in the code snippet below:
var data = { type: "doughnut", indexLabelPlacement: "inside", innerRadius: "60%", dataPoints: [ { y: 1, indexLabel: gauge.maximum + "", color: "transparent" }, { y: gauge.maximum - 2, color: "transparent", toolTipContent: null }, { y: 1, indexLabel: "0", color: "transparent" }, gauge.data, gauge.unoccupied, ], };
Please check this JSFiddle for a working example.
thanks, a lot It works!
You must be logged in to reply to this topic. Login/Register