Login to Ask a Question or Reply
Forum Replies Created by Thangaraj Raman
-
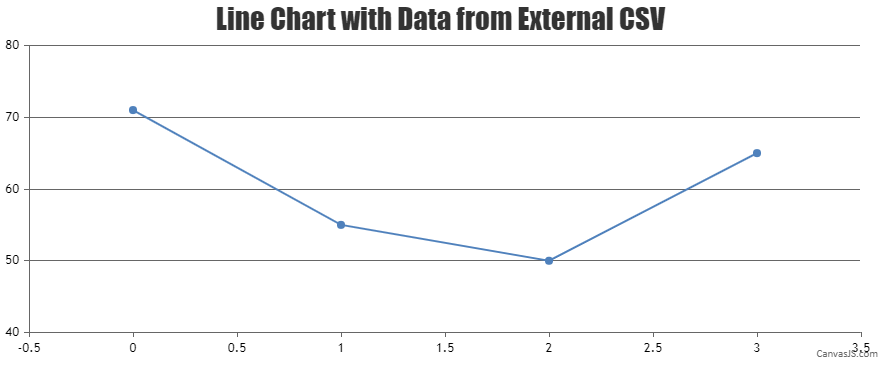
You can read a specific row from the CSV file by its index / header. Please take a look at this documentation page for a step-by-step tutorial on rendering charts with data from a CSV file and parsing it. Also, please refer to this article for more information on parsing CSV data.
—
Thangaraj Raman
Team CanvasJSYou can publish Google-Sheet as CSV and use the URL generated to fetch data using jQuery AJAX as shown in this JSFiddle.
—
Thangaraj Raman
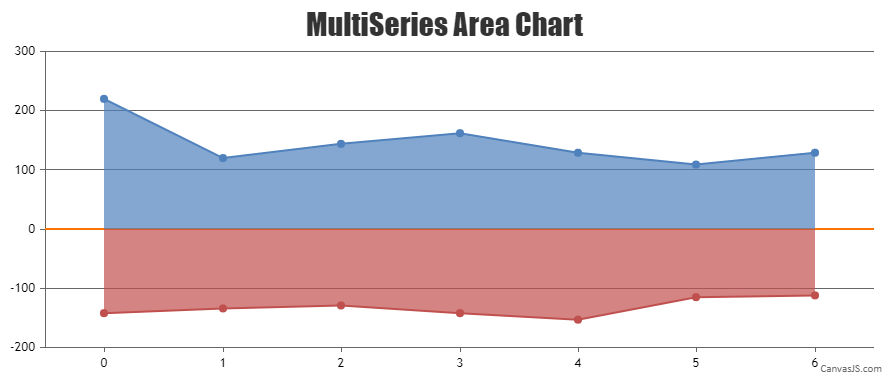
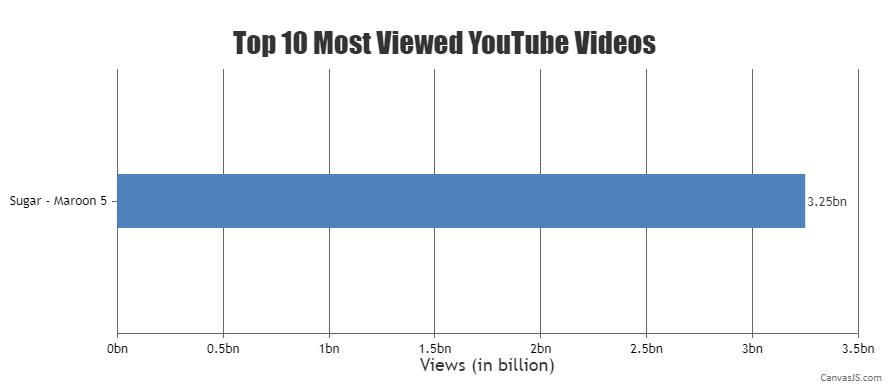
Team CanvasJSThe x-axis cannot be positioned to the middle of the chart as of now. However, you can create a multi-series area chart with positive and negative values to achieve your requirement.
Please check this JSFiddle for a working example.
—
Thangaraj Raman
Team CanvasJSYou can use labelFormatter function instead of valueFormatString and set the label format using the formatNumber() method. Please take a look at the code snippet below.
labelFormatter: function(e) {
   if(e.value >= 0 && e.value <= 1)
      return CanvasJS.formatNumber(e.value, "0.00");
   else if (e.value >= 1 && e.value <=10 )
      return CanvasJS.formatNumber(e.value, "0.0");
   else
      return CanvasJS.formatNumber(e.value, "0");
}
Please check this updated JSFiddle for a working example.
—
Thangaraj Raman
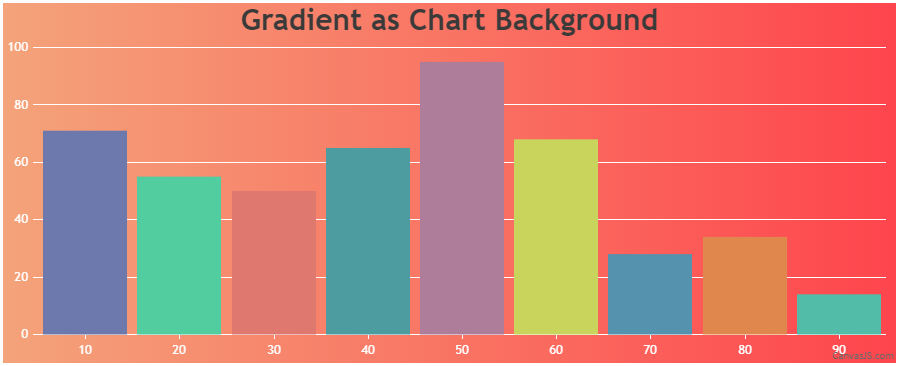
Team CanvasJSIn order to change the background color of the chart using CSS, you will have to first set the chart backgroundColor property to transparent. You can then, apply CSS styles to the chart container using the chart id.
Please check this JSFiddle for a working example similar to your requirement, which shows how to set gradient as chart background using CSS.
—
Thangaraj Raman
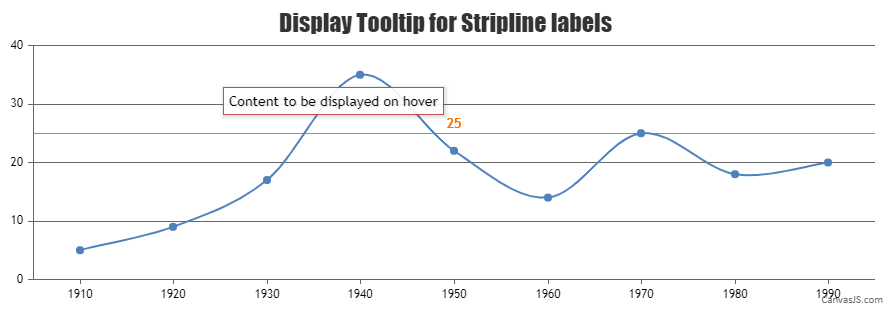
Team CanvasJSSorry, it is not possible to display a tooltip for stripline labels as of now. However, as a workaround, you can position the stripline label to the center of the plot area using the labelAlign property and add a scatter point for displaying the tooltip content. Please take a look at the code snippet below:
chart.addTo("data", {
    type: "scatter",
    markerSize: 0,
    highlightEnabled: false,
    toolTipContent: "Content to be displayed on hover",
    dataPoints: [{
      x: (chart.axisX[0].viewportMaximum + chart.axisX[0].viewportMinimum) / 2 ,
      y: chart.axisY[0].stripLines[0].value
    }]
})
Please check this JSFiddle for a working example.
—
Thangaraj Raman
Team CanvasJSIt looks like you are setting the axisX interval manually due to which the extra labels -1 and 1 are shown. Based on the interval & other factors, the axis range is calculated & hence the extra labels are added in this case. You can overcome this behavior by either not setting interval when there are fewer datapoints or by manually setting the axis range.
Please take a look at this JSFiddle for a working example.
—
Thangaraj Raman
Team CanvasJSYou can update the position of the scatter datapoints on resizing the window by calculating the width of the index labels and using convertPixeltoValue. Please check the code snippet below:
window.onresize = function() {
  indexLabelOffset = (chart.width < 700) ? 5 : 2 ;
  for(var i = 0; i < customLinesData.length; i++) {
    for(var j = 0; j < scatterDps.length; j++) {
      if( scatterDps[j].indexLabel === "\u25C0 " + customLinesData[i].label) {
	indexLabelWidth = getWidth(customLinesData[i].label);
     	scatterDps[j].x = customLinesData[i].x + chart.axisX[0].convertPixelToValue(indexLabelWidth) / 2 + indexLabelOffset;
      }
    }
  }
  chart.render();
};
Please take a look at this updated JSFiddle for a working example.
—
Thangaraj Raman
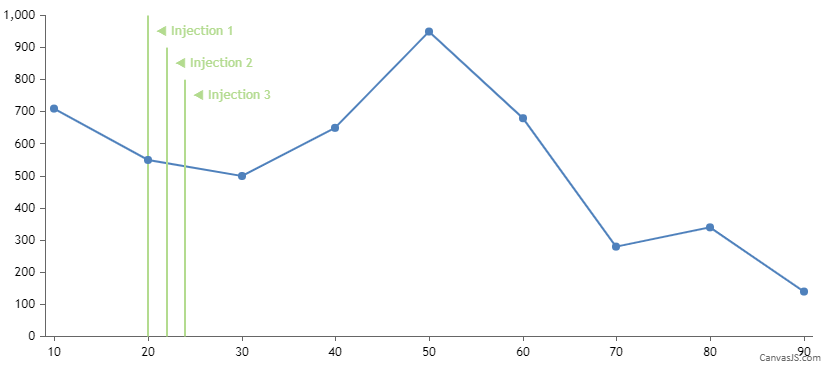
Team CanvasJSStriplines are drawn from end to end across the full width/height of the plot-area. However, in your case, you can use a multi-series line chart with interactivity disabled and 2 datapoints each to represent the start and end coordinates of the line. To display text representing each line, you can use a scatter chart with indexlabels.
Please take a look at this JSFiddle for a working example.
—
Thangaraj Raman
Team CanvasJSTo update the y value of a datapoint using a dropdown menu you need to update the chart options / data based on the options selected from the dropdown list. Please check the code snippet below.
var country = document.getElementById("country");
country.addEventListener( "change",  function(){
  for(var i = 0; i < chart.options.data[0].dataPoints.length; i++) {
    if(country.options[country.selectedIndex].text === chart.options.data[0].dataPoints[i].label)
      chart.options.data[0].dataPoints[i].y = Number(country.options[country.selectedIndex].value);
  }
  chart.render();
});
Please take a look at this JSFiddle for a working example.
—
Thangaraj Raman
Team CanvasJSIt seems to be working fine. Can you kindly create a sample project reproducing the issue you are facing and share it with us over Google Drive or OneDrive so that we can look into your code, run it locally at our end to understand the scenario better, and help you out?
—
Thangaraj Raman
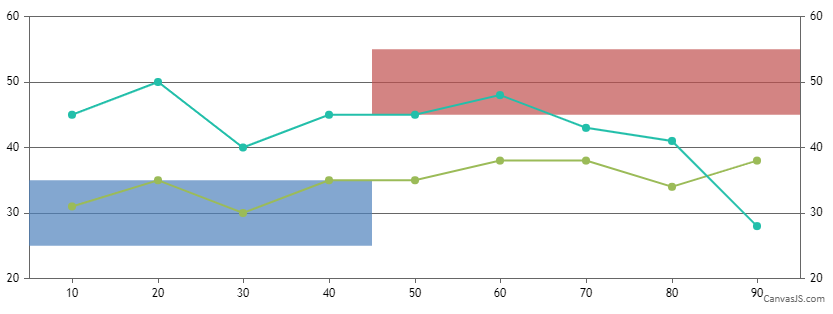
Team CanvasJSStriplines are drawn from end to end across the full width/height of the plot-area. You can use rangeArea chart with interactivity disabled for the corresponding dataseries to achieve your requirement.
Please take a look at this JSFiddle for a working example.
—
Thangaraj Raman
Team CanvasJSYou can pass x-value in date-time format and use valueFormatString to define how axis labels must be formatted before they appear on the x-axis.
—
Thangaraj Raman
Team CanvasJSPlease refer to this page for step by step tutorial on Creating Chart with data from JSON. The data from the JSON has to be parsed in the format accepted by CanvasJS.
—
Thangaraj Raman
Team CanvasJSIt looks like the sample provided by you is restricted and requires permission. Can you please make the image / sample public so that we can access it?

If the Google Drive link shared contains an image, can you kindly create JSFiddle reproducing the issue you are facing & share it with us so that we can look into the code / chart-options being used, understand the scenario better and help you out?
—
Thangaraj Raman
Team CanvasJS