Home Forums Chart Support Stripline – index label position – adjustments

Stripline – index label position – adjustments

Viewing 4 posts - 1 through 4 (of 4 total)
  • #40008

    Hi Team,

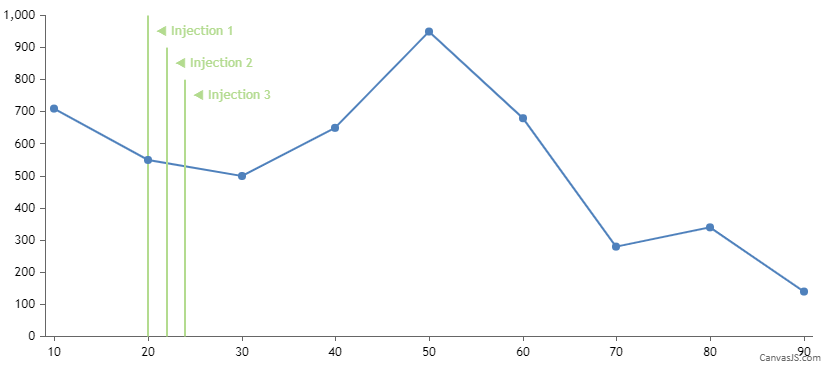
    We need to adjust the height of the index label position and stripline as like the attached image. Please let me know if there is any possibilities.

    Note: I have attached the Sample JSFiddle which I tried to figure out.

    #40020

    @elanchezhiyan,

    Striplines are drawn from end to end across the full width/height of the plot-area. However, in your case, you can use a multi-series line chart with interactivity disabled and 2 datapoints each to represent the start and end coordinates of the line. To display text representing each line, you can use a scatter chart with indexlabels.

    Please take a look at this JSFiddle for a working example.

    Multi Series Line Chart


    Thangaraj Raman
    Team CanvasJS

    #40043

    Hi @Thangaraj Raman,

    Thanks for the previous JSFiddle link. We have tried with the above example and we are facing few issues with that link. When we are resizing the chart, the label name and the arrow mark is collapsing each other. Also, the arrow mark should be nearer to the respective line. The chart is resizable so the arrow mark and the label name should have responsiveness.

    Please find the data in JSFiddle which we are using it.

    #40141

    @elanchezhiyan,

    You can update the position of the scatter datapoints on resizing the window by calculating the width of the index labels and using convertPixeltoValue. Please check the code snippet below:

    window.onresize = function() {
      indexLabelOffset = (chart.width < 700) ? 5 : 2 ;
      for(var i = 0; i < customLinesData.length; i++) {
        for(var j = 0; j < scatterDps.length; j++) {
          if( scatterDps[j].indexLabel === "\u25C0 " + customLinesData[i].label) {
    	indexLabelWidth = getWidth(customLinesData[i].label);
         	scatterDps[j].x = customLinesData[i].x + chart.axisX[0].convertPixelToValue(indexLabelWidth) / 2 + indexLabelOffset;
          }
        } 
      }
      chart.render();
    };

    Please take a look at this updated JSFiddle for a working example.


    Thangaraj Raman
    Team CanvasJS

Viewing 4 posts - 1 through 4 (of 4 total)

You must be logged in to reply to this topic.