Login to Ask a Question or Reply
You must be logged in to post your query.
Home › Forums › Chart Support › Changing background color using my own CSS
Changing background color using my own CSS
- This topic has 3 replies, 2 voices, and was last updated 2 years, 6 months ago by
ColibriSan.
-
January 2, 2023 at 5:17 pm #41841
Hi and happy new year to everybody,
i was wondering if there is a way to apply a CSS property coded in my main site CSS to the chart background.
i’ve a class inside my CSS that sets the color to black or white together with a transition time, depending on a button pression. I’d like to assign this class to the background color of my CanvasJS chart instead of setting the “backgroundColor” property to a simple “black” or “White” color.I’d like to do something like this:
document.getlElementByClassName(“class name pointing to the chart background”).classList.add(“blackTheme”);
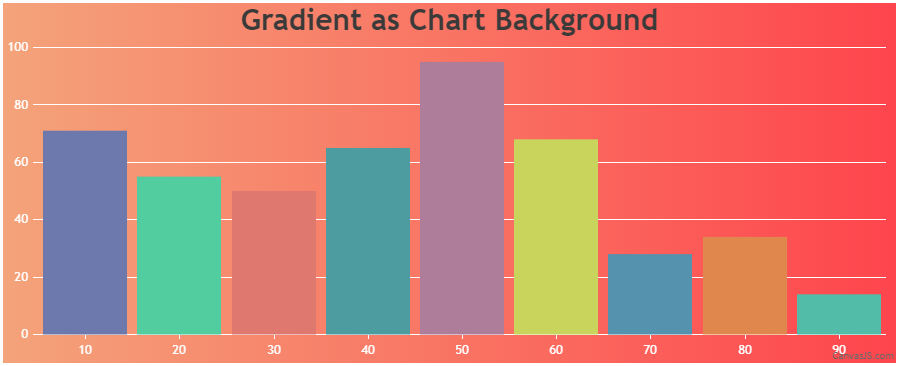
January 2, 2023 at 6:39 pm #41844In order to change the background color of the chart using CSS, you will have to first set the chart backgroundColor property to transparent. You can then, apply CSS styles to the chart container using the chart id.
Please check this JSFiddle for a working example similar to your requirement, which shows how to set gradient as chart background using CSS.

—
Thangaraj Raman
Team CanvasJSJanuary 4, 2023 at 5:11 am #41857Nevermind, i figured out using this command right after rendering the chart:
document.getElementsByClassName(“canvasjs-input-field”)[0].style.display = “none”;
document.getElementsByClassName(“canvasjs-input-field”)[1].style.display = “none”;January 4, 2023 at 9:36 am #41847Thanks for your fast reply, here is what i did, little different from your suggestion.
This is my need:
on my website i have a dark/white theme switcher that transform the background of my website from black to white and viceversa. The color changing is applied with a transition time of 1 second, so i don’t need gradients but a way to change the background color of my website in 1 second transition.Since the DIV that contains the chart is already changing the color when pressing the switch button, i’ve set the backgroundColor property to “transparent”, in this way the chart takes the color of it’s parent element (the DIV) without adding any line of code to the CSS. And in this way the behaviour is EXACTLY as expected.
There’s now a problem i did not expected:
i’ve set the “enabed = false” for the inputFields of the Range selector, and setting the chart backgroundColor = “transparent”, 2 rectangles appears right behind the Range Selector element i have on the chart. 2 rectangles with white background and black border line, as you can see in the attached image.The chrome inspector shows this for those due rectangles:
<input class=”canvasjs-input-field” type=”text” style=”-webkit-tap-highlight-color: transparent;”>
but as you can see from the image attached the background of the rectangles is white even if the overall background is black.
How can i get rid of that rectangles? i’d like to keep everything as it’s now since is working perfeclty, just want to remove those unwanted objects.
Black version:
https://imgur.com/tReqkNJWhite version
https://imgur.com/dlY7nNq
You must be logged in to reply to this topic.