Login to Ask a Question or Reply
Forum Replies Created by Suyash Singh
-
@fbk,
Please download the sample project.
Kindly follow the following steps:
1. Setup NodeJS.
2. Setup environment for socket.io.
3. Run the command –node index.jsfrom the given project.
4. Browse – http://localhost:3000 and you should be able to see your chart.___
Suyash Singh
Team CanvasJSSorry, we are unable to understand your requirements properly. Can you please clarify what do you mean by a customized flag? Is it an image or you want to draw flags on the chart yourself? Also it would be helpful if you can provide us with some pictorial representation.
___
Suyash Singh
Team CanvasJSThanks for the suggestion. I will discuss this with the team members and make changes if necessary.
___
Suyash Singh
Team CanvasJS1. Defining the stripLine height is not possible as of now.
2. For something like annotations you can position either image on the chart as in this example or add a scatter or bubble dataSeries as a work-around.
___
Suyash Singh
Team CanvasJSYou can add a vertical line to the chart by using striplines. Also for placing text at a specific position you can add a scatter series to the chart with indexLabel. Please have a look a this example.
___
Suyash Singh
Team CanvasJSMay 17, 2017 at 10:48 am in reply to: multiple datapoints for the same X-axis bucket has the x-axis values repeating #15150You can use labels instead of x-values. With date-time labels you can use labelFormatter to format the axisX labels. Here’s an example.
If this doesn’t suit your requirements, can you please provide us with some pictorial representation or jsfiddle so that we can help you out better?
___
Suyash Singh
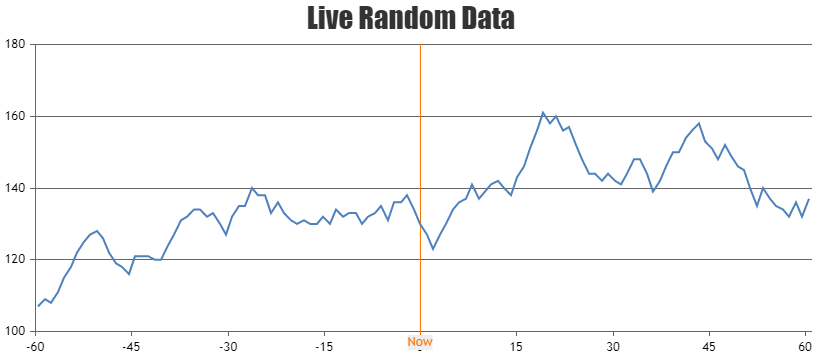
Team CanvasJSMay 17, 2017 at 10:14 am in reply to: Is there a bug with charts that go way into the future? #15148You can create dynamic chart with static x-axis by adding one more axisX and setting it’s stripLines, viewportMinimum and viewportMaximum as per your requirements. Also, you will need to hide the default axisX. Please have a look at below code snippet for axisX properties to be used.
axisX: [{
    tickLength: 0,
    lineThickness: 0,
    labelFormatter: function(e) {
      return "";
    },
    margin: -5
  }, {
    viewportMinimum: -60,
    viewportMaximum: 60,
    interval: 15,
    stripLines: [{
      value: 0,
      label: "Now",
      labelPlacement: "outside"
    }]
  }],
Also, check out this JSFiddle for complete code.

___
Suyash Singh
Team CanvasJSdataPointWidth applies to all the dataSeries present in the chart. You can’t mention dataPointWidth for specific series as of now.
___
Suyash Singh
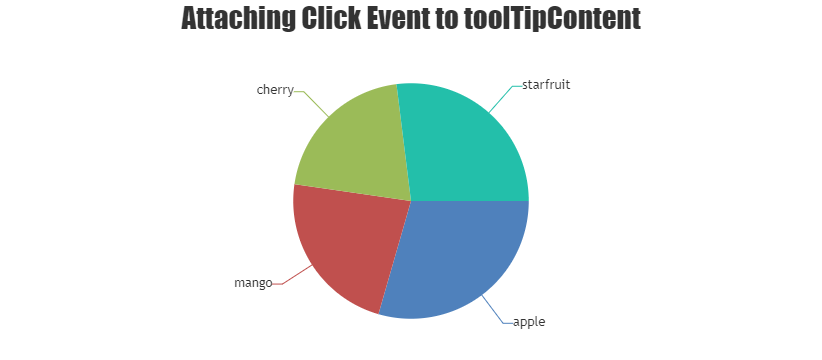
Team CanvasJSYou can do so by placing any HTML element (div, button etc.) in the toolTipContent and attaching click event handler to it. Please refer below codesnippet for toolTipContent that can be provided for such scenario.
toolTipContent: "<div id='toolTipContent' onclick='clickHandler()'>{label}: {y}</div>",Also, have a look at this JSFiddle for complete code.

___
Suyash Singh
Team CanvasJSIt seems like you haven’t defined rangeChanged, Check console if you are getting some error in the production environment. It would be helpful if you can share working code which reproduces the issue, so that we can look into it and help you to solve it.
___
Suyash Singh
Team CanvasJSstripLines have bounds, which you can use to detect if the click event has happened within that region. And you can redirect to some page if its within the stripLines bound. Please check this jsfiddle.
—
Suyash Singh
Team CanvasJSCan you kindly create a JSFiddle reproducing the issue you are facing and share it with us so that we can understand the scenario better and help you out?
—
Suyash Singh
Team CanvasJSYou can acheive this using jQuery swipeleft and swiperight events. Please check this jsfiddle.
—
Suyash Singh
Team CanvasJS