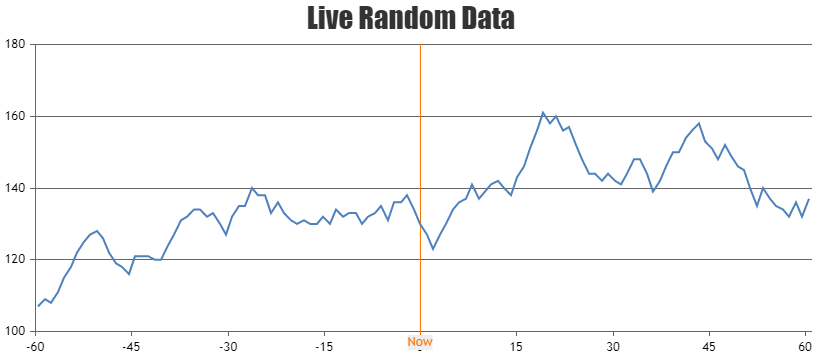
Home › forums › Chart Support › Dynamic chart with fixed X Axis
Tagged: chart, dynamic, fixed, x-axis
Hi,
I am trying to make a dynamic chart which has a fixed x-axis.
I am looking for the x-axis to be in seconds with the left being -60 secs, the center being 0 secs (now) and the right +60 secs. The graph is to be dynamic, so would like the x-axis to remain the same while the data moves left. As per the below screenshot.
Is this possible with canvasjs? I have had a few attempts but have been unsuccessful.
Thanks for any help.
http://imgur.com/TVmrL6C
@jyxx,
You can achieve this by having one more axisX with stripLines, viewportMinimum and viewportMaximum set as per your requirements. Also, you will need to hide the default axisX. Please have a look at this jsfiddle.
___ Suyash Singh Team CanvasJS
i want to have this same graph but data should be in sync order in which x axis should be static
@utsavgupta,
Can you please brief us further about your requirements along with some example or pictorial representation so that we can understand your scenario better and help you out?
—- Manoj Mohan Team CanvasJS
step Line Chart with time series
please see this here is a graph in which i want to set label in y axis and time in y-secondary axis dynamically
Please take a look at this documentation page for information on rendering a dynamic chart.
Adding date and time to axis Y is not available as of now. However, you can take a look at this workaround to achieve the same.
___________ Manoj Mohan Team CanvasJS
Some how it tried to make it and i made this,still i want to label the time available in x-secondary axis want to replace it with some label like M And N
i want to have this graph
You can achieve the above requirement by formatting the labels of axisX2 using labelFormatter.
You must be logged in to reply to this topic.