Login to Ask a Question or Reply
You must be logged in to post your query.
Home › Forums › Chart Support › Custom String label in Yaxis
Custom String label in Yaxis
- This topic has 8 replies, 4 voices, and was last updated 8 years, 2 months ago by
Bivek Singh.
Tagged: Custom label in Yaxis
-
May 11, 2017 at 10:29 pm #15091
Hi..
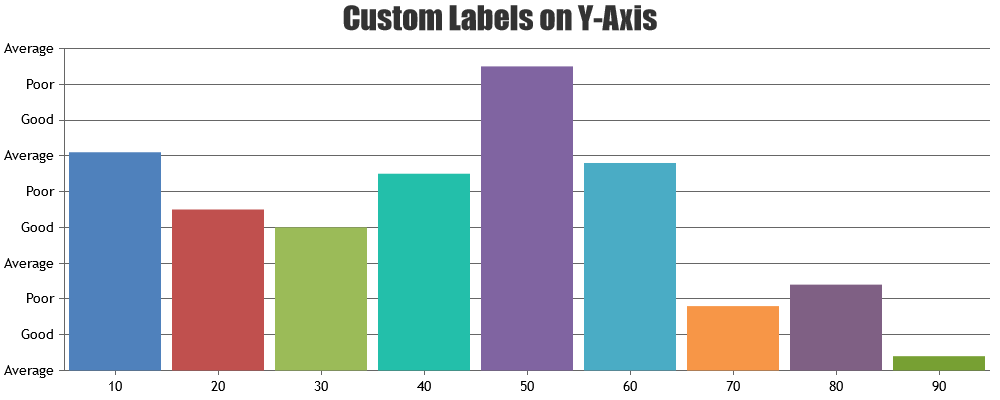
I am working with canvas js for rendering multiseries column chart with dynamic data. In y-axis I need to give text as label. For eg, it includes high,medium,poor as label in y axis. when i used it through labelformatter the 3 values get repeated for all x values.I have added below code:
var yLabels = [“Poor”,”Average”,”Good”];
var yLabelCounter=0;labelFormatter: function ( e ) {
var yCats = yLabels[yLabelCounter++];
if(yLabelCounter === yLabels.length)
yLabelCounter = 0;
return yCats;
}Please help me with detailed example..
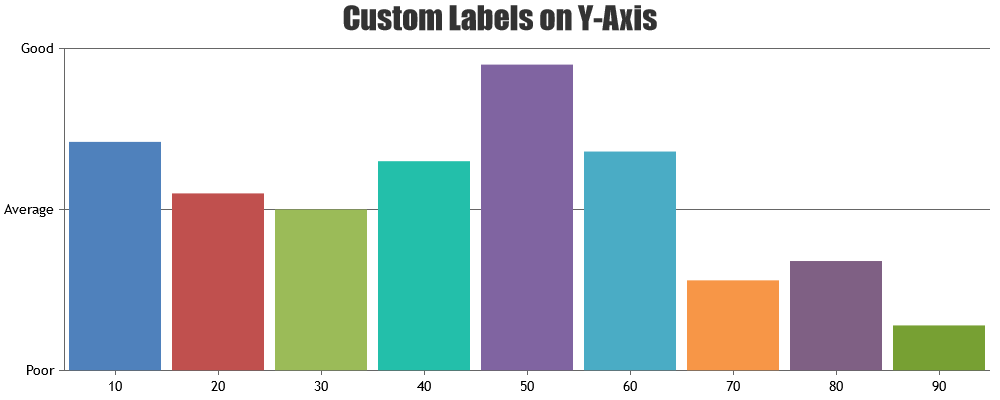
May 12, 2017 at 10:11 am #15094It seems like you are defining labelFormatter in axisX instead of axisY. Adding labelFormatter to axisY should work fine in your case.
Please take a look at this JSFiddle for working code.

—
Vishwas R
Team CanvasJSMay 12, 2017 at 10:36 am #15095Hi,
Thanks for your reply. I have checked this jsfiddle and exactly I am getting this type of graph only.Here in y axis labels “Poor”,”Average”,”Good” gets repeated many times. But I need to display it 1 time only. Is it possible to do that.. Please provide detailed example.May 12, 2017 at 5:39 pm #15098You can control number of labels by setting interval property. Please check this updated JSFiddle.

—
Vishwas R
Team CanvasJSMay 12, 2017 at 6:15 pm #15099Thanks Vishwas for your timely response.. It works for me too. Please guide me for displaying values of hour as label continuously in x-axis. Currently I am getting labels of x-axis based on dynamic data where labels are displaying intermittently . My code is :
axisX:
{
title: “Commit Time”,
titleFontSize: 10,
titleFontColor:”Brown”,
interval:1,
intervalType: “hour”,
valueFormatString: “hh TT”},
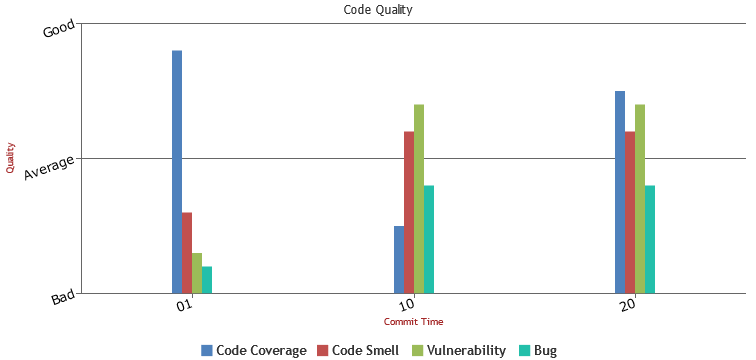
in x-axis i am getting only 11,21,10 labels. But I need x-axis labels as 00,01,02,03,04,….,24. Please guide me with example
May 15, 2017 at 12:54 pm #15116Can you kindly create a JSFiddle reproducing the issue you are facing and share it with us so that we can understand the scenario better and help you out?
—
Suyash Singh
Team CanvasJSMay 15, 2017 at 1:59 pm #15118I will paste my code here as jsfiddle didint wokr for me. Please refer it ..
<html>
<head>
<script type=”text/javascript” src=”https://code.jquery.com/jquery-2.1.4.js”></script>
<script type=”text/javascript” src=”canvasjs.min.js”></script>
<script type=”text/javascript”>
$(document).ready(function () {var dataPoints1 = [];
var dataPoints2 = [];
var dataPoints3 = [];
var dataPoints4 = [];
var yLabels = [“Bad”, “Average”, “Good”];
var yLabelCounter = 0;
var chart = new CanvasJS.Chart(“chartContainer”,
{
title:
{
text: “Code Quality”,
fontSize: 12,
fontFamily: “tahoma”,
},
tooltip: {
enabled: true,
/*contentFormatter: function (e) {
var content = “”;
for (var i = 0; i < e.entries.length; i++){
content = CanvasJS.formatDate(e.entries[i].dataPoint.x, “HH”);
}
return content;
}*/
},
// animationEnabled: true,
zoomEnabled: true,
dataPointWidth: 10,
axisX:
{
title: “Commit Time”,
titleFontSize: 10,
titleFontColor: “Brown”,
// interlacedColor: “#F0F8FF”,
interval: 1,
intervalType: “HH”,
valueFormatString: “HH:DD”,
labelAngle: -20,
includeZero: false,
//maximum: 24,
labelFontFamily: “Verdana”,
labelFontColor: “Black”,
labelFormatter: function (e) {
return CanvasJS.formatDate(e.value, “HH”);
}
/*labelFormatter: function (e) {
return CanvasJS.formatDate(e.value, “hh:mm TT”);
},*/
},
axisY:
{
title: “Quality”,
titleFontSize: 10,
titleFontColor: “Brown”,
labelAngle: -20,
labelFontFamily: “Verdana”,
labelFontColor: “Black”,
/*labelFormatter: function ( e ) {
var yCats = yLabels[yLabelCounter++];
if(yLabelCounter === yLabels.length)
yLabelCounter = 0;
return yCats;
} */
interval: 50,
labelFormatter: function (e) {
var yCats = yLabels[e.value / 50];
return yCats;
}
},
data: [
{
type: “column”,
cursor: “pointer”,
toolTipContent: “Coverage:{y}%,<br/>Task_id:1001,<br/> no. of lines:{lines}, <br/> start_line:101 , <br/> end_line:500”,
// lineDashType: “dot”,
// lineColor: “red”,
// fillOpacity: .3,
xValueType: “date”,
y: “{y}”,
showInLegend: true,
name: “Code Coverage”,
dataPoints: dataPoints1
},
{
type: “column”,
cursor: “pointer”,
toolTipContent: “Smell:{y}%,<br/> Task_id:1001,<br>no. of lines:{lines}, <br/> start_line:101 , <br/> end_line:500”,
xValueType: “date”,
showInLegend: true,
name: “Code Smell”,
y: “{y}”,
dataPoints: dataPoints2
},
{
type: “column”,
cursor: “pointer”,
toolTipContent: “Vulnerability:{y}%,<br/> Task_id:1001,<br> no. of lines:{lines}, <br/> start_line:101 , <br/> end_line:500”,
xValueType: “date”,
showInLegend: true,
name: “Vulnerability”,
y: “{y}”,
dataPoints: dataPoints3
},
{
type: “column”,
cursor: “pointer”,
toolTipContent: “Bug:{y}%,<br/> Task_id:1001,<br> no. of lines:{lines}, <br/> start_line:101 , <br/> end_line:500”,
xValueType: “date”,
showInLegend: true,
name: “Bug”,
y: “{y}”,
dataPoints: dataPoints4
},
]
});// Ajax request for getting JSON data
//Replace data.php with your JSON API’s url$.getJSON(“data2.txt”, function (data) {
for (var i = 0; i < data.length; i++) {
var formatted_date = new Date(data[i].date);
var lines = data[i].lines;
//var hours = formatted_date.getHours();
dataPoints1.push({label: formatted_date, y: data[i].coverage,lines:lines});
dataPoints2.push({label: formatted_date, y: data[i].smell,lines:lines});
dataPoints3.push({label: formatted_date, y: data[i].vulnerability,lines:lines});
dataPoints4.push({label: formatted_date, y: data[i].bug,lines:lines});
}// chart.options.data[0].dataPoints = dataPoints1;
chart.render();
});
});
</script>
</head>
<body><div id=”chartContainer” style=”width: 50%; height: 350px;”></div>
</body>
</html>[{“date”:”2017-05-10 1:14:12″,”coverage”:90,”smell”:30,”vulnerability”:15,”bug”:10,”commit_id”:”09rhggsadj”,”project”:”hvx”,”version”:1,”lines”:70},
{“date”:”2017-05-11 10:34:12″,”coverage”:25,”smell”:60,”vulnerability”:70,”bug”:40,”commit_id”:”09rhjigsj”,”project”:”hvx”,”version”:2,”lines”:90},
{“date”:”2017-05-11 20:34:12″,”coverage”:75,”smell”:60,”vulnerability”:70,”bug”:40,”commit_id”:”09rhjigsj”,”project”:”hvx”,”version”:2,”lines”:100}]May 17, 2017 at 10:26 am #15149Since you are storing date as labels and not as x-value, you should use
e.labelinstead ofe.valuein labelFormatter function of axisX. Please take a look at this updated JSFiddle.

—-
Bivek Singh
Tagged: Custom label in Yaxis
You must be logged in to reply to this topic.