Login to Ask a Question or Reply
Forum Replies Created by Priyanka M S
-
Nirmalya,
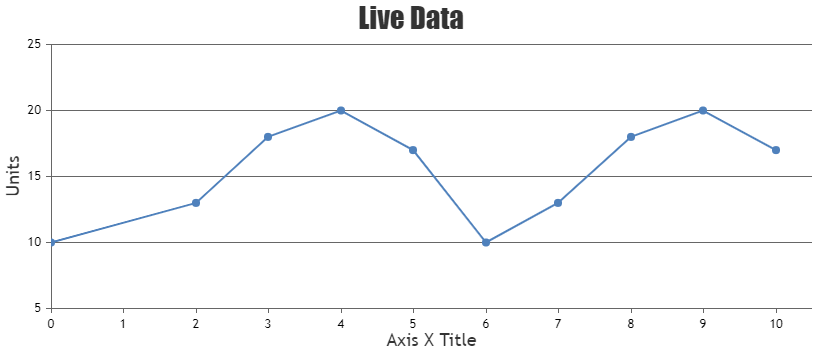
Axis-X does not start from 0 (zero) because of the auto-calculated axis minimum. However, it is possible to begin Axis-X from 0 by setting axis minimum to 0 and resetting it by setting it to null while updating the chart. Please take a look at the code snippet below for the same.
var chart = new CanvasJS.Chart("chartContainer",{
  title :{
    text: "Live Data"
  },
  exportEnabled: true,
  axisX: {
    title: "Axis X Title",
    minimum: 0
  },
  axisY: {
    title: "Units"
  },
  data: [{
    type: "line",
    dataPoints : dps
  }]
});

chart.render();
var xVal = dps.length + 1;
var yVal = 15;
var updateInterval = 10000;
var updateChart = function () {
  chart.options.axisX.minimum = null;
  yVal = yVal + Math.round(5 + Math.random() *(-5-5));
  dps.push({x: xVal,y: yVal});

  xVal++;
  if (dps.length > 10 )
  {
    dps.shift();
  }

  chart.render();
};

setInterval(function(){updateChart()}, updateInterval);
Also, have a look at this JSFiddle for complete working code.
__
Priyanka M S
Team CanvasJSAarti,
We are looking into it and will get back to you at the earliest.
—
Priyanka M S
Team CanvasJSJune 13, 2018 at 8:02 pm in reply to: I would like to build a draggable column charts side by side in a row. #21091@ymadhumanchi,
We are looking into it and will get back to you at the earliest.
__
Priyanka M S
Team CanvasJSWe have just released v2.1.3 with this bug fix. Please refer to the release blog for more information. Do download the latest version from our download page and let us know your feedback.
—
Priyanka M S
Team CanvasJSWe have just released v2.1.3 with this bug fix. Please refer to the release blog for more information. Do download the latest version from our download page and let us know your feedback.
—
Priyanka M S
Team CanvasJSIt is possible to calculate the range between the two selected dataPoints (select by clicking on dataPoints) with the help of click event.
Please take a look at this jsfiddle.__
Priyanka M S
Team CanvasJSAarti,
Please take a look at this updated jsfiddle.
If this doesn’t work at your end, can you kindly provide the following details, so that we can try reproducing the issue you are facing and help you with a solution.
1. CanvasJS version
2. Browser details like browser name and version
3. OS details like build and version
4. Console errors if any__
Priyanka M S
Team CanvasJSKim,
Guage chart is in our roadmap, but no definite timeline yet.
__
Priyanka M S
Team CanvasJSAarti,
We are looking into it and will get back to you at the earliest.
__
Priyanka M S
Team CanvasJSIt is possible to make the marker visible only when condition is met. For which, you need to set markerSize to zero at dataSeries level and set the markerSize to a desired value for the dataPoint that satisfies the condition. Please take a look at this jsfiddle.
__
Priyanka M S
Team CanvasJSYou can use x-values along with labels to achieve this. You can group same labels by having same x-values to them. Please take a look at this jsfiddle.
__
Priyanka M S
Team CanvasJSYou can display the x axis labels from data retrieved from CSV file by pushing the dataPoints with labels along with y-values to chart. Please take a look at this jsfiddle.
If this doesn’t solve your requirement, please share a jsfiddle, so that we can understand your requirement better and help you out.__
Priyanka M S
Team CanvasJS