Login to Ask a Question or Reply
Forum Replies Created by Priyanka M S
-
Please take a look at these fiddles.
1.Fiddle1
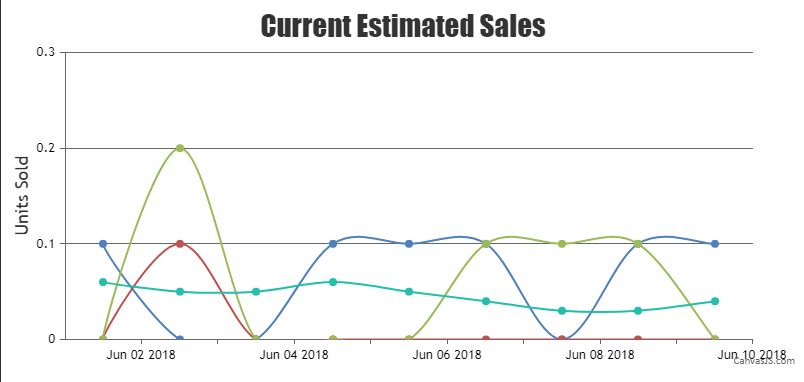
2.Fiddle2if you look at this, the other charts are not showing. Please help me to fix this issue.
The values of other dataPoints are very less as compared to the maximum y value in dps array. Hence, the other dataPoints will stick to the axis.
Also if you look at the other link, you will see the blue part and the yellow part. For the higher value that is also not showing
The blue, yellow parts(stacked charts) are not been shown up as their threshold values are very less as compared to the maximum y value of the dps array.
You can set the threshold value for the blue, yellow and red stacked charts based on your requirement. Please check calculateThreshold() in provided fiddles to set the threshold value for the stacked charts.__
Priyanka M S
Team CanvasJS@samira.2018
You can eliminate the past dataPoint values by comparing timestamps of individual dataPoints against the current time.
Kindly take a look at the code snippet below,
 function addDps(chart){
    var currentTime = new Date().getTime();
    for (var i = 0; i < dps.length; i++) {
       if((dps[i][4] >= 1527835332000)){
            dataPoints1.push({
              x: new Date(dps[i][4]),
              y: parseFloat(dps[i][0])
            });
            dataPoints2.push({
              x: new Date(dps[i][4]),
              y: parseFloat(dps[i][1])
            });
            dataPoints3.push({
              x: new Date(dps[i][4]),
              y: parseFloat(dps[i][2])
            });
            dataPoints4.push({
              x: new Date(dps[i][4]),
              y: parseFloat(dps[i][3])
            });
       }
    }
}
Please take a look at this JSfiddle for an example with complete code on displaying chart after removing all previous days data from current time.
__
Priyanka M S
Team CanvasJSPlease take a look at Pyramid charts. Pyramid charts cannot be rendered with axis. However, if you want to place text beneath the chart, you can use subtitles and set verticalAlign:”bottom” , horizontalAlign:”center” properties. Please take a look at this fiddle
__
Priyanka M S
Team CanvasJS@patricia.a.lopes1,
You can’t make AJAX requests to the local filesystem due to security issue. As a workaround, you can store the file on a local webserver and make an AJAX call to it or you can store the JSON in CORS enabled JSON hosting service like myjson.com. Please take a look at this tutorial on rendering charts from JSON API using AJAX.
__
Priyanka M S
Team CanvasJShari,
Are you looking for something like this? If not, please share a pictorial representation of your requirement, so that we can understand it better and help you out.
__
Priyanka M S
Team CanvasJShari,
stack multiple graphs on each other and have synchronized zoom, pan and scroll
It is possible to synchronize zoom and pan for multiple charts. Please take a look at this fiddle and also refer the tutorial for the same.
is there a way to position the X-axis at the top of the graph
You can position X-axis on top (secondary axis) by setting axisXType property to ‘secondary’.
__
Priyanka M S
Team CanvasJSMay 18, 2018 at 11:12 am in reply to: The update is made by pressing F5 in my browser for refesh. I'd like to be graph #20778According to tutorials from different sources, its suggested to refresh the page automatically every n-seconds. Please take a look at this updated sample project.
1. Auto-Reloading part of webpage every 5 seconds.
2. Auto-RefreshYou can further try to improve it to refresh the page whenever there is change in data.
__
Priyanka M S
Team CanvasJSIs there any alternatives? can I access the X-axis datapoint position from outside chart?
You can get the position of dataPoint by using convertValueToPixel() method.
Can I apply labelFontColor from datapoint instead of axisX
Labels are properties of axis, labelFontColor can only be used inside axis. However you can have indexLabel for every dataPoint and customize it’s color using indexLabelFontColor.
__
Priyanka M S
Team CanvasJSMay 17, 2018 at 10:08 am in reply to: The update is made by pressing F5 in my browser for refesh. I'd like to be graph #20765Thanks for sharing the sample project. We will look into the issue and get back to you at the earliest. Meanwhile you can refer following tutorials on auto-refresh/reloading a part of webpage.
1. Auto-Reloading part of webpage every 5 seconds.
2. Auto-Refresh
3. Auto refresh page on data change – Stackoverflow__
Priyanka M S
Team CanvasJS@samira.2018,
It is possible to display multiple charts in the same page with the same chart options and different dataPoints.
You will have to create multiple chartContainers with separate id for each, and create multiple charts which you can assign to specific chartContainers and call the corresponding chart render method.
Please take a look at the code snippet below,var chart1 = new CanvasJS.Chart("chartContainer1",{ title :{ text: "Live Data" }, data: [{ type: "line", dataPoints : [ { label: "apple", y: 10 }, { label: "orange", y: 15 }, { label: "banana", y: 25 }, { label: "mango", y: 30 }, { label: "grape", y: 28 } ] }] }); var chart2 = new CanvasJS.Chart("chartContainer2",{ title :{ text: "Live Data" }, data: [{ type: "column", dataPoints : [ { label: "apple", y: 10 }, { label: "orange", y: 15 }, { label: "banana", y: 25 }, { label: "mango", y: 30 }, { label: "grape", y: 28 } ] }] }); chart1.render(); chart2.render();Also, kindly take a look at our documentation page for a step-by-step tutorial on how to render multiple charts in a page.

__
Priyanka M S
Team CanvasJS-
This reply was modified 8 years, 1 month ago by
Priyanka M S.
Chart animates only on first chart render as of now. We will reconsider this behavior to animate chart every-time it renders for future releases.
__
Priyanka M S
Team CanvasJSIt is possible to show current data in dynamic graph, by using shift method to remove the previous data. Please take a look at this tutorial on creating dynamic charts.
__
Priyanka M S
Team CanvasJS -
This reply was modified 8 years, 1 month ago by