Home Forums Chart Support The ‘0’ on X-axis doesn’t start from the origin

The ‘0’ on X-axis doesn’t start from the origin

Viewing 2 posts - 1 through 2 (of 2 total)
  • #21103

    Hi, I am using the following code

    <!DOCTYPE HTML>
    <html>
    <head>
    	<script type="text/javascript">
    	window.onload = function () {
    
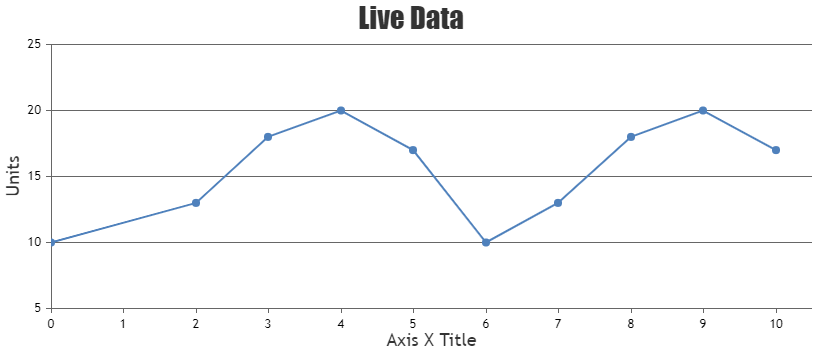
          var dps = [{x: 0, y: 10}, {x: 2, y: 13}, {x: 3, y: 18}, {x: 4, y: 20}, {x: 5, y: 17},{x: 6, y: 10}, {x: 7, y: 13}, {x: 8, y: 18}, {x: 9, y: 20}, {x: 10, y: 17}];   //dataPoints. 
    
          var chart = new CanvasJS.Chart("chartContainer",{
          	title :{
          		text: "Live Data"
          	},
          	axisX: {						
          		title: "Axis X Title"
          	},
          	axisY: {						
          		title: "Units"
          	},
          	data: [{
          		type: "line",
          		dataPoints : dps
          	}]
          });
    
          chart.render();
          var xVal = dps.length + 1;
          var yVal = 15;	
          var updateInterval = 1000;
    
          var updateChart = function () {
          	
          	
          	yVal = yVal +  Math.round(5 + Math.random() *(-5-5));
          	dps.push({x: xVal,y: yVal});
          	
          	xVal++;
          	if (dps.length >  10 )
          	{
          		dps.shift();				
          	}
    
          	chart.render();		
    
    	// update chart after specified time. 
    
    };
    
    setInterval(function(){updateChart()}, updateInterval); 
    }
    </script>
    <script type="text/javascript" src="https://cdn.canvasjs.com/canvasjs.min.js"></script>
    </head>
    <body>
    	<div id="chartContainer" style="height: 300px; width: 100%;">
    	</div>
    </body>
    </html>

    Here the ‘0’ on X-axis doesn’t start from the origin. It starts from a distance away from the origin. Can anyone help to get this fixed?

    #21117

    Nirmalya,

    Axis-X does not start from 0 (zero) because of the auto-calculated axis minimum. However, it is possible to begin Axis-X from 0 by setting axis minimum to 0 and resetting it by setting it to null while updating the chart. Please take a look at the code snippet below for the same.

    var chart = new CanvasJS.Chart("chartContainer",{
      title :{
        text: "Live Data"
      },
      exportEnabled: true,
      axisX: {
        title: "Axis X Title",
        minimum: 0
      },
      axisY: {
        title: "Units"
      },
      data: [{
        type: "line",
        dataPoints : dps
      }]
    });
    
    chart.render();
    var xVal = dps.length + 1;
    var yVal = 15;
    var updateInterval = 10000;
    var updateChart = function () {
      chart.options.axisX.minimum = null;
      yVal = yVal + Math.round(5 + Math.random() *(-5-5));
      dps.push({x: xVal,y: yVal});
    
      xVal++;
      if (dps.length > 10 )
      {
        dps.shift();
      }
    
      chart.render();
    };
    
    setInterval(function(){updateChart()}, updateInterval);

    Also, have a look at this JSFiddle for complete working code.

    Chart in which axisX begins at 0

    __
    Priyanka M S
    Team CanvasJS

Viewing 2 posts - 1 through 2 (of 2 total)

You must be logged in to reply to this topic.