Today we are releasing 2.1.3 GA with a few bug fixes and enhancements. Below is a summary of this release.

Bug Fixes:
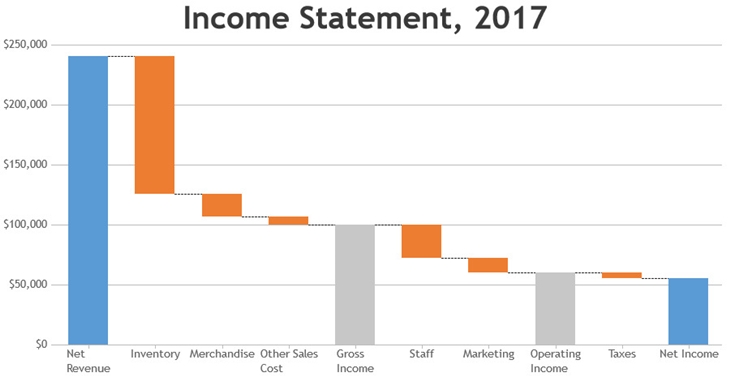
- In few cases of waterfall chart when y-values of the falling dataPoint was between -1 and 0, the connecting line between the falling dataPoint and its previous dataPoint was not drawn properly.
- Falling color was not being applied to the dataPoint when y-value was ranging from -1 to 0, in waterfall chart.
- In few cases of stacked 100% (stackedColumn100, stackedBar100 & stackedArea100) charts, there was a small gap towards the extreme end of the last dataPoint.
Change in Behaviour:
- When lineDashType property was set at dataSeries / dataPoint level, it was getting applied to marker border as well. Now, the marker border will always remain solid.
We thank Kuhuycoi and Koji Yoneda for reporting the issues.
Do download the latest version from our download page and let us know your feedback.
Thank You,
Vishwas R
Team CanvasJS
Leave a Reply