Login to Ask a Question or Reply
Forum Replies Created by Manoj Mohan
-
The code shared above seems to be working fine. Please take a look at this StackBlitz project for the same.
Can you kindly create a sample project reproducing the issue either in StackBlitz or locally & share it with us over Google-Drive or Onedrive. Also, kindly brief us more about the issue you are facing along with the version of CanvasJS StockChart that you are using so that we can understand the scenario better and help you out.
—-
Manoj Mohan
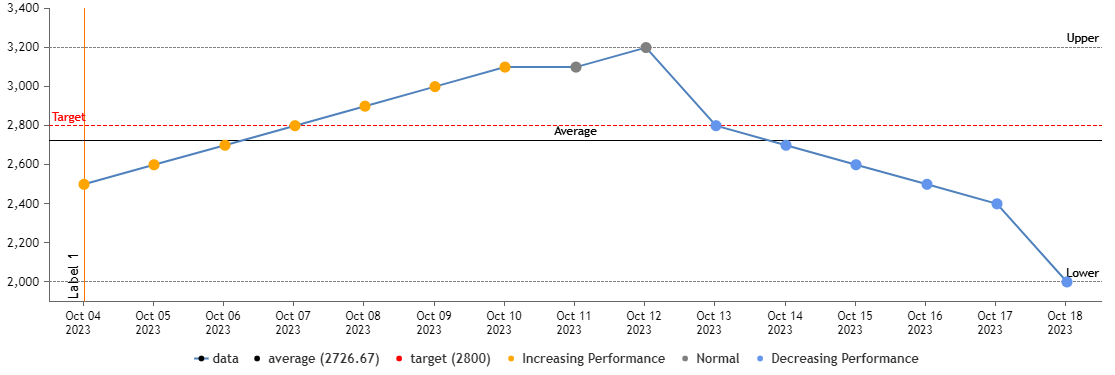
Team CanvasJSLegends are generally shown in dataseries level except pie, donut, funnel & pyramid charts. However, you can add dummy dataseries to achieve your requirement. Please take a look at this updated sample project.
—-
Manoj Mohan
Team CanvasJSIf you are looking to pass variable from PHP to JS, please refer to this page. If this doesn’t meet your requirement, kindly brief us further about your requirement so that we can understand your scenario better and help you out with an appropriate solution.
—-
Manoj Mohan
Team CanvasJSYou can get the chart toolbar reference using
document.getElementsByClassName("canvasjs-chart-toolbar")[0]. You can add extra options like ‘Export as PDF’ or pass url under it to the obtained toolbar reference. Also, please take a look at this JSFiddle for an example where “Export as CSV” feature is added to the toolbar.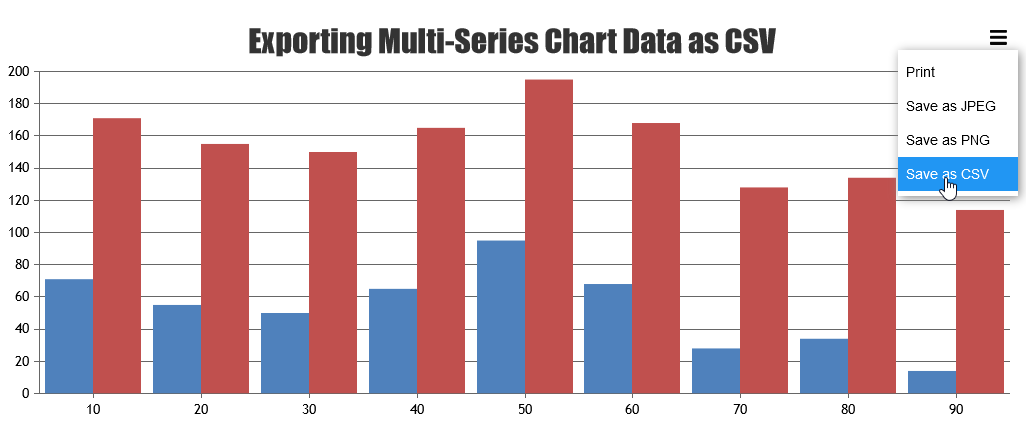
—-
Manoj Mohan
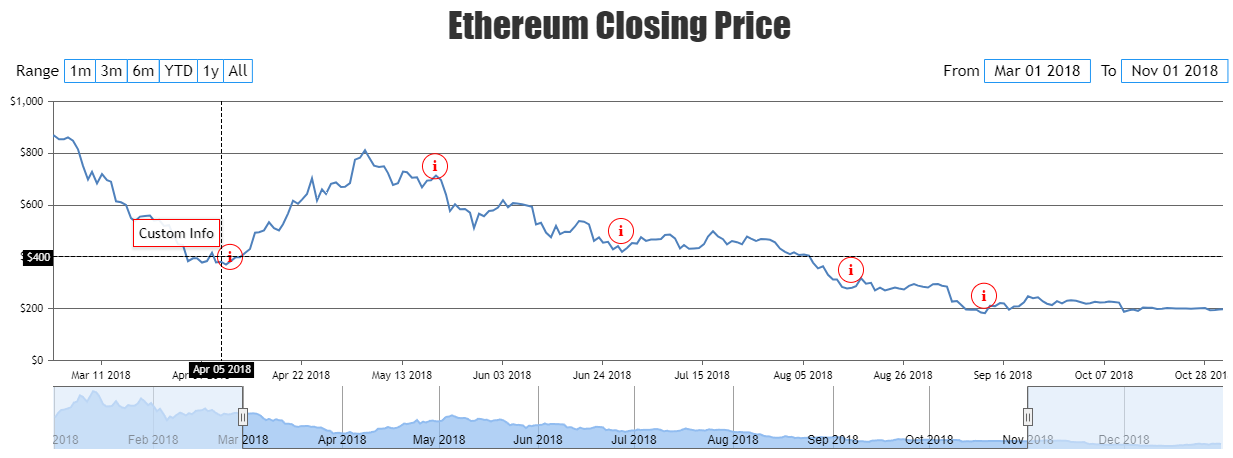
Team CanvasJSYou can check if tooltip is shown for overlapped datapoint using updated event of toolTip and show the tooltip for scatter series when it overlaps with the help of showAtX method. Please take a look at the code snippet below for the same.
toolTip: {
  updated: function(e) {
    var dp = false;
    // skip the check if tooltip is shown for scatter series
    if(e.entries.length == 1 && e.entries[0].dataSeriesIndex == 0 ) {
      dp = overlappedScatterSeriesDatapoint(e.entries[0].dataPoint, e.entries[0].dataPointIndex);
      if(dp) {
        stockChart.charts[0].toolTip.showAtX(dp.x, 1);
      }
    }
  }
}
.
.
function overlappedScatterSeriesDatapoint(dataPoint, index) {
  var radius = stockChart.charts[0].data[1].get("markerSize") / 2;
  var currentX = stockChart.charts[0].axisX[0].convertValueToPixel(dataPoint.x);
  var currentY = stockChart.charts[0].axisY[0].convertValueToPixel(dataPoint.y);

  for (var i=0; i<stockChart.charts[0].data[1].dataPoints.length; i++) {
    var dpX = stockChart.charts[0].axisX[0].convertValueToPixel(stockChart.charts[0].data[1].dataPoints[i].x)
    var dpY = stockChart.charts[0].axisY[0].convertValueToPixel(stockChart.charts[0].data[1].dataPoints[i].y)
    var distance = Math.sqrt((currentX - dpX) * (currentX - dpX) + (currentY - dpY) * (currentY - dpY));

    // Check if tooltip is shown for datapoints overlapped with scatter data series
    if(distance <= radius) {
      return stockChart.charts[0].data[1].dataPoints[i]
    }
  }

  return false;
}
Also, check out this JSFiddle for complete working code.
—-
Manoj Mohan
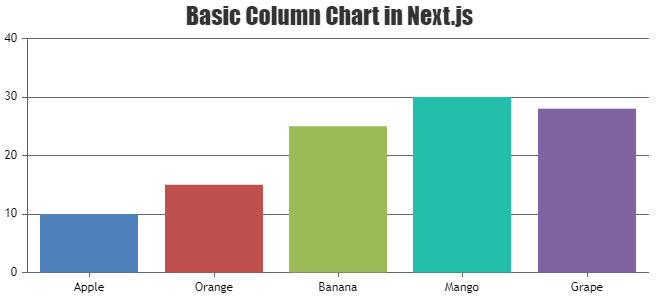
Team CanvasJSCanvasJS seems to be working fine with Next.js. Please take a look at this sample project for integration of CanvasJS Charts with Next.js.
If you are still facing the issue, kindly create sample project reproducing the issue you are facing and share it with us over Google-Drive or Onedrive so that we can look into your code, run it locally at our end to understand the scenario better and help you out.
—-
Manoj Mohan
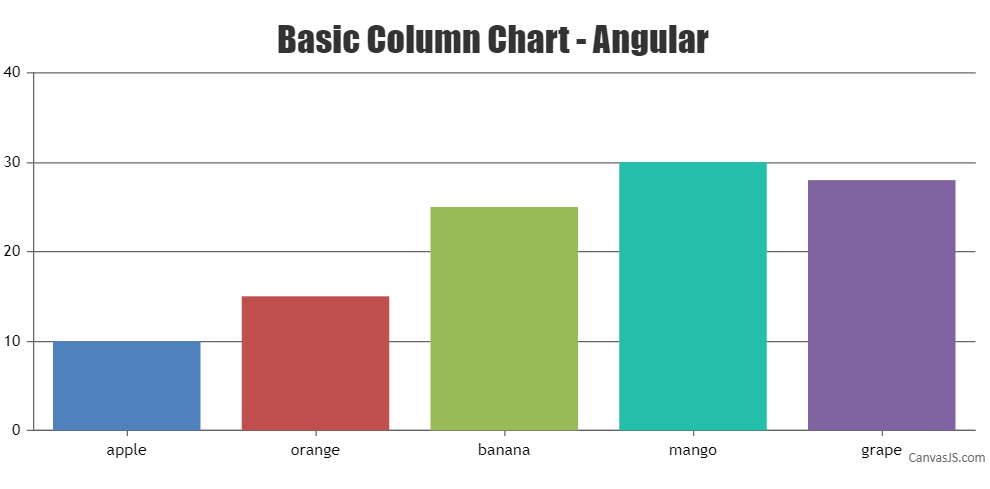
Team CanvasJSJuly 27, 2023 at 6:37 pm in reply to: Importing CanvasJSAngularChartsModule in my module throwing error #43443@canvasjs/angular-charts supports Angular 12+ as of now. If you like to add CanvasJS Angular chart in Angular 11, we suggest you to use CanvasJS Angular component that’s included in the build available in our download page. Please take a look at this Stackblitz project for an example on creating chart in Angular 11.
—-
Manoj Mohan
Team CanvasJSYou can check out CanvasJS StockChart which contains navigator and range selector to zoom into a region and select the range of values to be shown in the viewport of chart.
If this doesn’t meet your requirement, kindly share a pictorial representation and brief us further about your requirement so that we can understand your scenario better and help you out with an appropriate solution.
—-
Manoj Mohan
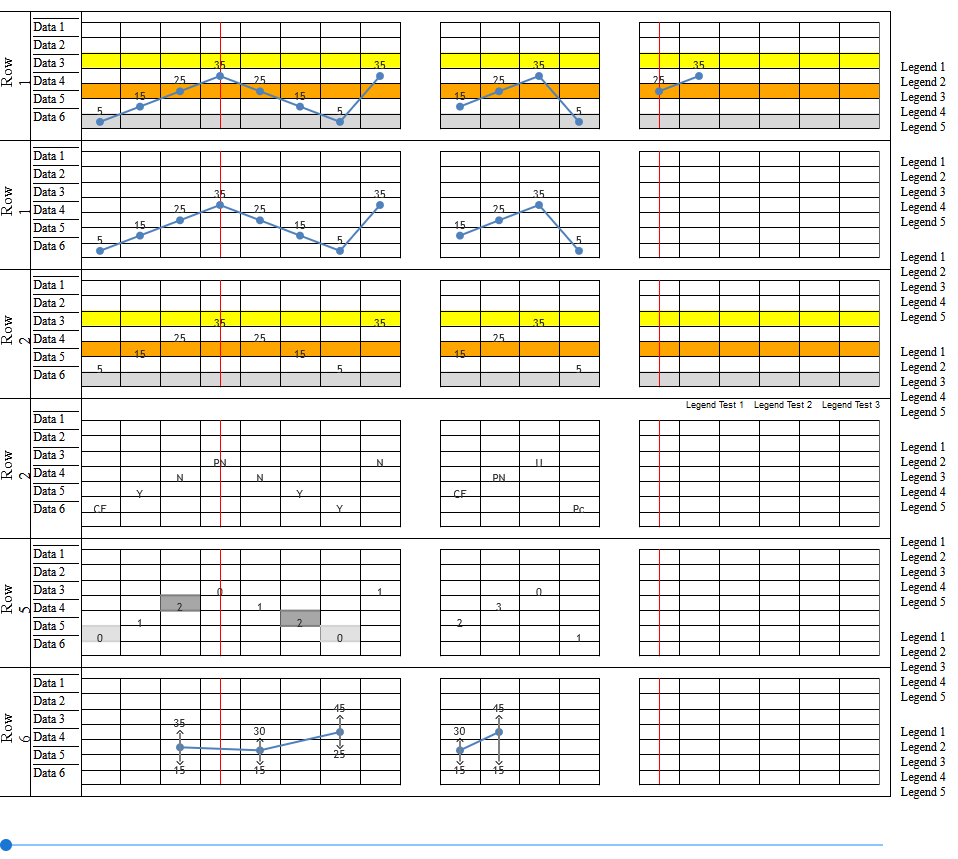
Team CanvasJSJuly 19, 2023 at 9:58 am in reply to: chart with grid columns (vertical gridline space) and horizontal scrolling #43365You can use vuetify slider component to control the data to be viewed in all the charts. Please take a look at this updated sample project[Link removed] for the same.
—-
Manoj Mohan
Team CanvasJSJuly 17, 2023 at 6:35 pm in reply to: chart with grid columns (vertical gridline space) and horizontal scrolling #43353We are looking into your query and get back to you at the earliest.
—-
Manoj Mohan
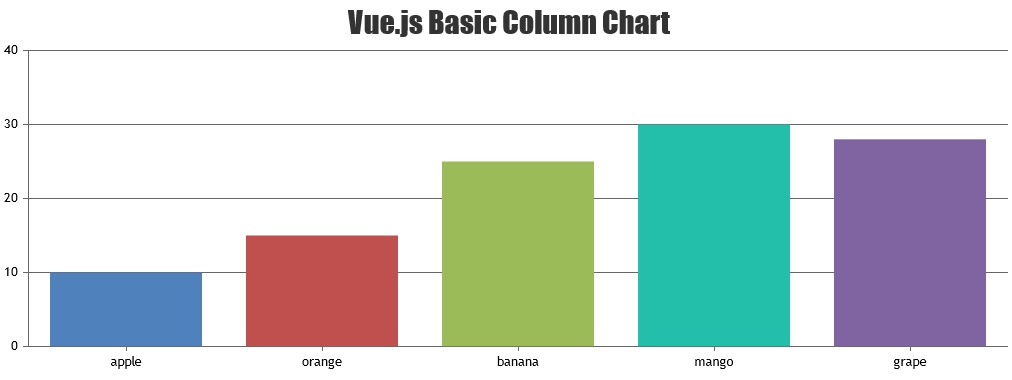
Team CanvasJS@canvasjs/vue-charts supports from Vue 3+ as of now. However, you can use CanvasJS Vue Component(CanvasJSVueComponent.vue) to integrate CanvasJS Chart in Vue 2 applications. Please take a look at this sample project for an example on integration in Vue 2.
—–
Manoj Mohan
Team CanvasJSAs addressed in the previous reply, you can use either Fetch API or ajax request to get the content of text file hosted in your server. Please take a look at the code snippet below for an example on the same using Fetch API.
fetch(url).then(res => res.text()).then(textContent => renderChart(textContent));If you are still facing the issue, kindly create sample project reproducing the issue and share it with us over Google-Drive or Onedrive along with sample data so that we can look into your code, run it locally at our end to understand the scenario better and help you out.
—-
Manoj Mohan
Team CanvasJSWe have released v3.7.11 GA with improvements for chromium based browsers, please check out release blog for more information. Please download the latest version from our download page and let us know your feedback.
—-
Manoj Mohan
Team CanvasJSWe have released v3.7.11 GA with improvements for chromium based browsers, please check out release blog for more information. Please download the latest version from our download page and let us know your feedback.
—-
Manoj Mohan
Team CanvasJS