Login to Ask a Question or Reply
You must be logged in to post your query.
Home › Forums › Chart Support › synchronize chart
synchronize chart
- This topic has 4 replies, 2 voices, and was last updated 3 years, 1 month ago by
Manoj Mohan.
Tagged: Django Python
-
June 16, 2023 at 12:52 pm #43086
Hii Sir,
1.I am unable to find the solution that when select the parameter’s from dropdown box it cant render individually i.e., when I change the parameter of 1st chart after that after that i used changed the parameter of rest of the charts .
2. After that when parameter have been changed the synchronization of time will be miss match so that when i hover on chart it will show the data of that chart only rest of the chart data cannot be displayed on hovering.
plz refer the below link for your better understanding.
June 19, 2023 at 6:29 pm #431261.I am unable to find the solution that when select the parameter’s from dropdown box it cant render individually i.e., when I change the parameter of 1st chart after that after that i used changed the parameter of rest of the charts .
You can bind id insted of class of the dropdown to detect the change in dropdown values and update the respective chart based on selected value of dropdown.
2. After that when parameter have been changed the synchronization of time will be miss match so that when i hover on chart it will show the data of that chart only rest of the chart data cannot be displayed on hovering.
Since you are using snapToDataPoint to true, the crosshair will be shown for nearest datapoint if datapoint is not present at the specified value. By setting snapToDataPoint to false seems to be working fine in your case.
Please take a look at this updated sample project for working code.
—-
Manoj Mohan
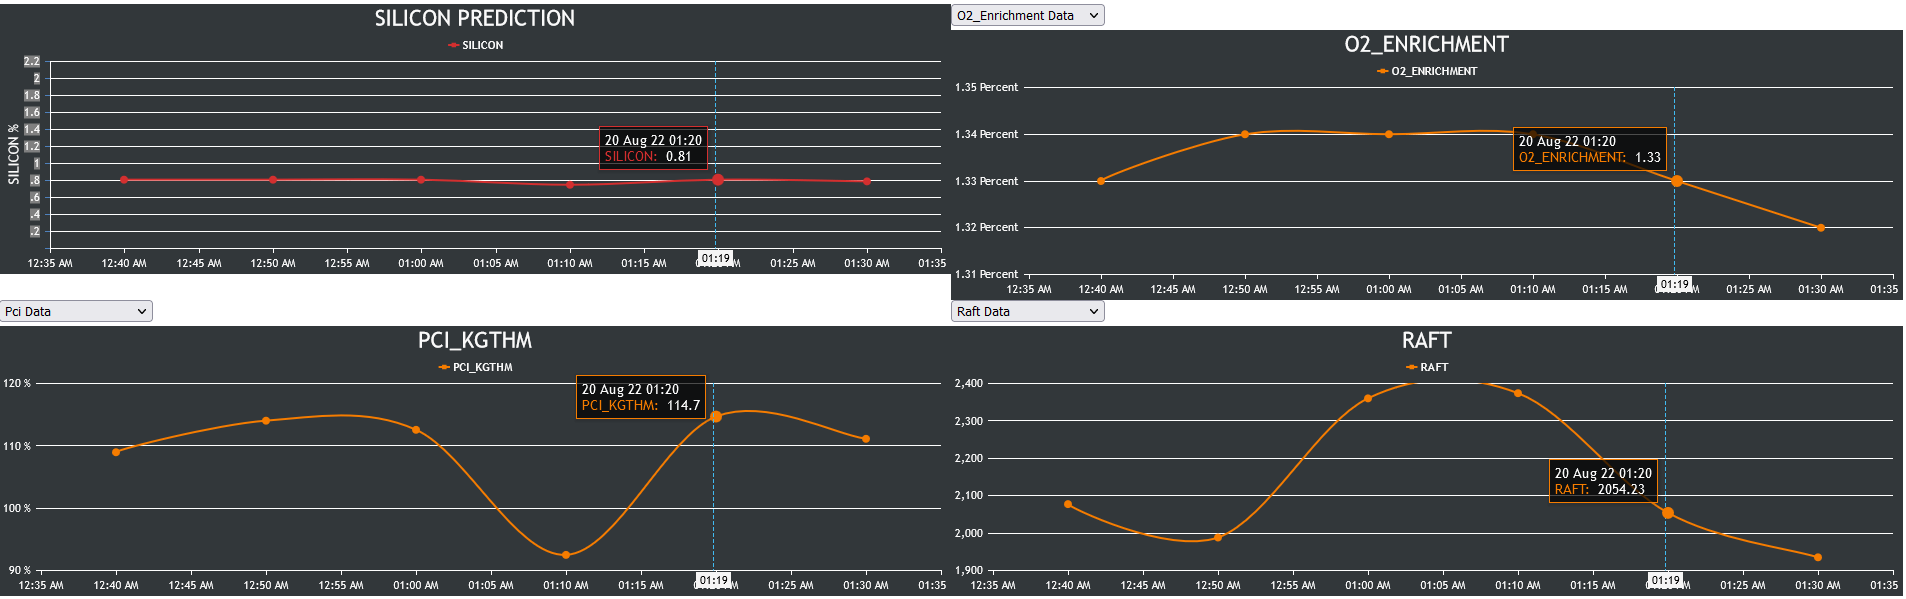
Team CanvasJSJune 20, 2023 at 4:10 pm #43140sir it doesn’t work as you see in this screen short. After selecting data from dropdown when the trending starts the time in X-axis didn’t sync with each other chart and on hovering on data point only that data is showing where pointer is placed and rest of three chart are blank on hovering.
June 21, 2023 at 9:49 am #43141sir i have attached the picture of chart that should be drawn after updated here the link of image file is given
June 22, 2023 at 5:19 pm #43163Since you are setting interval individually for all the chart, the datapoints in the chart are not matching with each other. Instead you can render all the charts at the same time by looping around all the charts and pushing the datapoints with similar x-value to all chart.
function updateChart() {
  for(var i=0; i<charts.length; i++) {
    if(mapChartDataPoints[i] != null) {
      var dps = mapChartDataPoints[i];
      charts[i].options.data[0].dataPoints.push({x: new Date(dps[CounterDps].BATCH_TIME), y: parseFloat(dps[CounterDps].VALUE)});
      charts[i].data[0].dataPoints.shift();
      charts[i].render();
    }
  }
  CounterDps++;
}
Please take a look at this updated sample project for complete working code.
—-
Manoj Mohan
Team CanvasJS
Tagged: Django Python
You must be logged in to reply to this topic.