Login to Ask a Question or Reply
You must be logged in to post your query.
Home › Forums › Chart Support › TWO graph in one page
TWO graph in one page
- This topic has 10 replies, 2 voices, and was last updated 3 years ago by
Manoj Mohan.
Tagged: line graph using Highcharts
-
June 5, 2023 at 9:32 am #42937
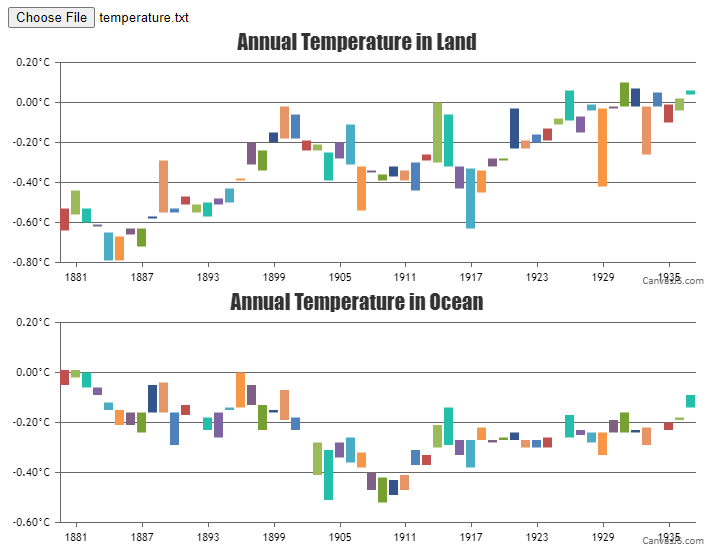
I have another question, how about if theres TWO different data in one text and I want to create a 2 graphs output in one page?
Example:Mean Surface Air Temperature over Ocean or Land Areas (C)
Annual Mean Anomalies with respect to 1951-1980Year Land_Annual Lowess(5) | Ocean_Annual Lowess(5)
—————————————————–
1880 -0.64 -0.53 | -0.05 0.01
1881 -0.44 -0.56 | 0.01 -0.02
1882 -0.53 -0.60 | 0.00 -0.06
1883 -0.61 -0.62 | -0.06 -0.09
1884 -0.79 -0.65 | -0.15 -0.12
1885 -0.79 -0.67 | -0.21 -0.15
1886 -0.63 -0.66 | -0.21 -0.16
1887 -0.72 -0.63 | -0.24 -0.16
1888 -0.57 -0.58 | -0.05 -0.16
1889 -0.29 -0.55 | -0.04 -0.16
1890 -0.55 -0.53 | -0.29 -0.16
1891 -0.47 -0.51 | -0.13 -0.17
1892 -0.55 -0.51 | -0.18 -0.18
1893 -0.57 -0.50 | -0.23 -0.18
1894 -0.51 -0.48 | -0.26 -0.16
1895 -0.50 -0.43 | -0.14 -0.15
1896 -0.39 -0.38 | 0.00 -0.14
1897 -0.20 -0.31 | -0.05 -0.13
1898 -0.34 -0.24 | -0.23 -0.13
1899 -0.15 -0.20 | -0.16 -0.15
1900 -0.02 -0.18 | -0.07 -0.19
1901 -0.06 -0.18 | -0.18 -0.23
1902 -0.24 -0.19 | -0.26 -0.26
1903 -0.24 -0.21 | -0.41 -0.28
1904 -0.39 -0.25 | -0.51 -0.31
1905 -0.20 -0.28 | -0.28 -0.34
1906 -0.11 -0.31 | -0.26 -0.36
1907 -0.54 -0.32 | -0.32 -0.38
1908 -0.35 -0.34 | -0.47 -0.40
1909 -0.39 -0.36 | -0.52 -0.42
1910 -0.32 -0.37 | -0.49 -0.43
1911 -0.39 -0.34 | -0.47 -0.41
1912 -0.44 -0.30 | -0.31 -0.37
1913 -0.26 -0.29 | -0.37 -0.33
1914 0.00 -0.30 | -0.21 -0.30
1915 -0.06 -0.32 | -0.14 -0.29
1916 -0.43 -0.32 | -0.33 -0.27
1917 -0.63 -0.33 | -0.38 -0.27
1918 -0.45 -0.34 | -0.22 -0.27
1919 -0.28 -0.32 | -0.27 -0.28
1920 -0.29 -0.28 | -0.26 -0.27
1921 -0.03 -0.23 | -0.24 -0.27
1922 -0.23 -0.19 | -0.30 -0.27
1923 -0.20 -0.16 | -0.30 -0.27
1924 -0.19 -0.13 | -0.30 -0.26
1925 -0.08 -0.11 | -0.26 -0.26
1926 0.06 -0.09 | -0.17 -0.26
1927 -0.15 -0.07 | -0.23 -0.25
1928 -0.01 -0.04 | -0.28 -0.24
1929 -0.42 -0.03 | -0.33 -0.24
1930 -0.02 -0.03 | -0.19 -0.24
1931 0.10 -0.02 | -0.16 -0.24
1932 0.07 -0.02 | -0.24 -0.23
1933 -0.26 -0.02 | -0.29 -0.22
1934 0.05 -0.02 | -0.22 -0.22
1935 -0.10 -0.01 | -0.23 -0.20
1936 -0.04 0.02 | -0.19 -0.18
1937 0.04 0.06 | -0.09 -0.14Then I want to create a separate graph for “Land_Annual Lowess(5)” and “Ocean_Annual Lowess(5)
” to give two comparisons of each graph. WHEN it show on graph there will be two graph output. Thank You foor the assitanceJune 5, 2023 at 6:43 pm #42956You can create multiple charts in a single page by providing separate container and options for each chart as shown in this documentation page. In order to use single text file to render multiple charts, you need to parse the data from text file to the format accepted by CanvasJS. Please take a look at the code snippet below for the same.
function handleFiles() {
  var fileList = this.files;
  var reader = new FileReader();

  reader.readAsText(fileList[0]);
  reader.onload = function() {
    renderChart(reader);
  }

}

function renderChart(reader) {
  var dpsList = reader.result;
  var dataPoint;

  dpsList = dpsList.split("\n");

  for(var i = 1; i < dpsList.length; i++) {
    var separateData = dpsList[i].split(" ");
    yValLand = [parseFloat(separateData[1]), parseFloat(separateData[2])];
    yValOcean = [parseFloat(separateData[4]), parseFloat(separateData[5])];
    xVal = new Date(parseInt(separateData[0]), parseInt(separateData[1]));

    landTempChart.options.data[0].dataPoints.push({x: xVal, y: yValLand})
    oceanTempChart.options.data[0].dataPoints.push({x: xVal, y: yValOcean})
  }

  landTempChart.render();
  oceanTempChart.render();
}
Also, check out this JSFiddle for complete working code.
—-
Manoj Mohan
Team CanvasJSJune 5, 2023 at 8:47 pm #42959Nice Sir Thank you, but when I applied to read the temperature.txt it doesn’t read the file, so whats wrong on it? Im just using your sample snippet above but it didnt show the graph?
June 6, 2023 at 6:54 pm #42970The JSFiddle shared above seems to be working fine with the temperature.txt file which contains the data shared by you.
If you are still facing the issue, kindly share sample data you are using for temperature.txt so that we can reproduce the issue at our end, understand the scenario better and help you out.
—-
Manoj Mohan
Team CanvasJSJune 19, 2023 at 9:48 am #43105Ah I see now the problem Sir. If the tst format is this:
Mean Surface Air Temperature over Ocean or Land Areas (C)
Annual Mean Anomalies with respect to 1951-1980Year Land_Annual Lowess(5) | Ocean_Annual Lowess(5)
—————————————————–
1880 -0.64 -0.53 | -0.05 0.01
1881 -0.44 -0.56 | 0.01 -0.02
1882 -0.53 -0.60 | 0.00 -0.06
1883 -0.61 -0.62 | -0.06 -0.09
1884 -0.79 -0.65 | -0.15 -0.12
1885 -0.79 -0.67 | -0.21 -0.15
1886 -0.63 -0.66 | -0.21 -0.16
1887 -0.72 -0.63 | -0.24 -0.16
1888 -0.57 -0.58 | -0.05 -0.16
1889 -0.29 -0.55 | -0.04 -0.16
1890 -0.55 -0.53 | -0.29 -0.16
1891 -0.47 -0.51 | -0.13 -0.17
1892 -0.55 -0.51 | -0.18 -0.18
1893 -0.57 -0.50 | -0.23 -0.18
1894 -0.51 -0.48 | -0.26 -0.16
1895 -0.50 -0.43 | -0.14 -0.15
1896 -0.39 -0.38 | 0.00 -0.14
1897 -0.20 -0.31 | -0.05 -0.13
1898 -0.34 -0.24 | -0.23 -0.13
1899 -0.15 -0.20 | -0.16 -0.15
1900 -0.02 -0.18 | -0.07 -0.19
1901 -0.06 -0.18 | -0.18 -0.23
1902 -0.24 -0.19 | -0.26 -0.26
1903 -0.24 -0.21 | -0.41 -0.28
1904 -0.39 -0.25 | -0.51 -0.31
1905 -0.20 -0.28 | -0.28 -0.34
1906 -0.11 -0.31 | -0.26 -0.36
1907 -0.54 -0.32 | -0.32 -0.38
1908 -0.35 -0.34 | -0.47 -0.40
1909 -0.39 -0.36 | -0.52 -0.42
1910 -0.32 -0.37 | -0.49 -0.43
1911 -0.39 -0.34 | -0.47 -0.41
1912 -0.44 -0.30 | -0.31 -0.37
1913 -0.26 -0.29 | -0.37 -0.33
1914 0.00 -0.30 | -0.21 -0.30
1915 -0.06 -0.32 | -0.14 -0.29
1916 -0.43 -0.32 | -0.33 -0.27
1917 -0.63 -0.33 | -0.38 -0.27
1918 -0.45 -0.34 | -0.22 -0.27
1919 -0.28 -0.32 | -0.27 -0.28
1920 -0.29 -0.28 | -0.26 -0.27
1921 -0.03 -0.23 | -0.24 -0.27
1922 -0.23 -0.19 | -0.30 -0.27
1923 -0.20 -0.16 | -0.30 -0.27
1924 -0.19 -0.13 | -0.30 -0.26
1925 -0.08 -0.11 | -0.26 -0.26
1926 0.06 -0.09 | -0.17 -0.26
1927 -0.15 -0.07 | -0.23 -0.25
1928 -0.01 -0.04 | -0.28 -0.24
1929 -0.42 -0.03 | -0.33 -0.24
1930 -0.02 -0.03 | -0.19 -0.24
1931 0.10 -0.02 | -0.16 -0.24
1932 0.07 -0.02 | -0.24 -0.23
1933 -0.26 -0.02 | -0.29 -0.22
1934 0.05 -0.02 | -0.22 -0.22
1935 -0.10 -0.01 | -0.23 -0.20
1936 -0.04 0.02 | -0.19 -0.18
1937 0.04 0.06 | -0.09 -0.14Will do work fine BUT if using the ACTUAL format text like this in link
https://www.pimohweather.com/data/temperature.txt
it turns it will not shown the graph. Theres something wrong when the column spaces differ, can you try using the actual txt format like on the link? TYJune 19, 2023 at 6:25 pm #43125It seems like the text file you are passing contains multiple space between values in a line. To overcome this you can split each line with the help of regex like
/\s+/instead of just giving space" ". Also you need skip the lines from the text files which doesn’t contain data for the chart. For e.g. in above text file, you should start parsing it from 5th linefor(var i = 4; i < dpsList.length; i++).var separateData = dpsList[i].split(/\s+/);—-
Manoj Mohan
Team CanvasJSJune 20, 2023 at 1:51 pm #43137Nice Sir it worked, So I should take note when skipping text and alos to read the parsed value it should expressed to .split(/\s+/) instead. Thank You Sir for the help.
June 20, 2023 at 3:02 pm #43138Now last Question Sir, how to read the txt file if my text file is on my server instead of using file imput, it should auto reads the txt file automatically without needing of uploading the Temperature.txt manually?
June 22, 2023 at 5:18 pm #43162June 26, 2023 at 6:27 pm #43195(Sorry I cant post the part script because I get blocked if I post the script to show you.
but I try to do Jquery and Sget function and both seems doesnt read the txt file. I cant post some message here regarding the script I did because I get blocked here in JS but to get you the info that I did some which uses ajax or get function, but it doesnt work Sir :(
July 4, 2023 at 6:46 pm #43256As addressed in the previous reply, you can use either Fetch API or ajax request to get the content of text file hosted in your server. Please take a look at the code snippet below for an example on the same using Fetch API.
fetch(url).then(res => res.text()).then(textContent => renderChart(textContent));If you are still facing the issue, kindly create sample project reproducing the issue and share it with us over Google-Drive or Onedrive along with sample data so that we can look into your code, run it locally at our end to understand the scenario better and help you out.
—-
Manoj Mohan
Team CanvasJS
Tagged: line graph using Highcharts
You must be logged in to reply to this topic.