Home Forums Chart Support Y-Axis Formatting

Y-Axis Formatting

Viewing 7 posts - 1 through 7 (of 7 total)
  • #43015

    How do we set parameters for the Y-axis? The graph is of a fixed height, but the range of the Y-variables can be as small as a unit of 1 with no upper limit. A small range means a graph with very misleading erratic swings. Is there a way to automatically format the y-axis to avoid those erratic swings?

    #43028

    @supportprojectionsmart-com,

    Can you kindly share a JSFiddle or a pictorial representation of your requirements so that we can understand your scenario better and help you out?

    —-
    Manoj Mohan
    Team CanvasJS

    #43089

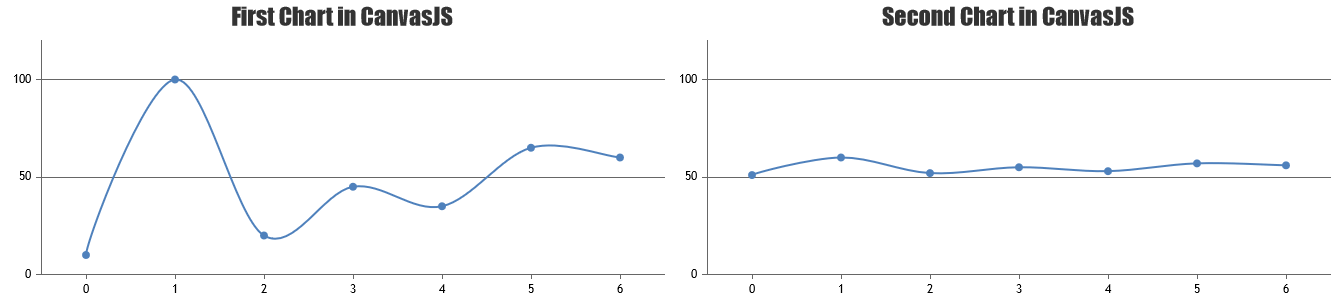
    Two graphs look identical in their shape, but the Y-axis on the first graph covers a range of nearly 100, while the Y-axis on the second covers a range of only 9. The two presentations make the two data sets look similar.

    However, if I adjust the Y-axis for the second graph to the same (larger) range as the first graph, then it is clear that the large fluctuations in the second graph are actually quite small. The change to the Y-axis has flattened out the second graph, making it look very different from the first graph.

    If I’m presenting two comparable data sets, I want to have similar Y-axis ranges. Can I do that in CanvasJS?

    Is there a way I can attach pictures of what I mean?

    #43091

    @supportprojectionsmart-com,

    Is there a way I can attach pictures of what I mean?

    You can upload image in imgur.com and share the link with us to show your requirements.

    —-
    Manoj Mohan
    Team CanvasJS

    #43108

    Is there something wrong with this post? My replies containing the link to the image are not appearing.

    #43099

    Here’s the image

    https://imgur.com/a/Y6mg1rp

    #43129

    @supportprojectionsmart-com,

    You can set viewportMinimum & viewportMaximum properties across all the charts to show same y-axis range between them. Please take a look at this JSFiddle for an example on the same.

    Sync Y-Axis Range across Multiple charts in CanvasJS

    —-
    Manoj Mohan
    Team CanvasJS

Viewing 7 posts - 1 through 7 (of 7 total)

You must be logged in to reply to this topic.